Imperata Grassland Mapping in Northern Uplands of Lao PDR: Area, Distribution, Characteristics, and Implications for Slash-and-Burn Cultivation
Bounthanh Keoboualapha,* Thaworn Onpraphai,** Attachai Jintrawet,** Suchint Simaraks,* and Anan Polthanee*
*ບຸນທັນ ແກ້ວບົວລະພາ; สุจินต์ สิมารักษ์; อนันต์ พลธานี System Approaches in Agriculture Program, Faculty of Agriculture, Khon Kaen University, 123 Moo 16 Mittapap Rd., Nai-Muang, Muang District, Khon Kaen 40002, Thailand
Corresponding author’s e-mail: k.bounthanh[at]gmail.com
**ถาวร อ่อนประไพ; อรรถชัย จินตะเวช Crop Science and Natural Resources Department and Multiple Cropping Center, Faculty of Agriculture, Chiang Mai University, 239 Huay Kaew Road, Muang District, Chiang Mai 50200, Thailand
DOI: doi.org/10.20495/seas.2.2_383
Slash-and-burn cultivation (SBC) is an important food and cash crop production system in mountainous regions of many countries in Southeast Asia. While links between unsustainable SBC and the formation of Imperata grassland (IGL) have been well documented, there has been limited research on the issues with the intention of providing appropriate information to communities in Laos aiming at better use of natural resources. This paper reveals the IGL area, distribution, and characteristics in the uplands of northern Laos, and discusses the importance of IGL for upland development based on the synthesis of remotely sensed Landsat-5 TM and GIS data. We have demonstrated the potential use of geoinformation technology as a set of informatics tools that can be applied in other area studies in Laos. Nineteen land uses/land covers of 196,317 hectares in Nambak District in northern Laos were mapped with an overall accuracy of 92.1% and a kappa statistic of 91.3%. IGL achieved >90% mapping accuracy. The current IGL was estimated at about 2.5% (4,878 hectares) of the district area and characterized as a “micro-grassland,” with most patch sizes being less than half a hectare. About 37% of the district area in the southeastern part was identified as the most Imperata-infested zone. The study suggests that improper SBC intensification into more permanent crop production systems is a major cause of Imperata infestation in the upland areas and that the spread of IGL can be a threat to the productivity and sustainability of traditional SBC systems and already intensified land use systems. In order to utilize land resources more effectively, government intervention is indispensable; and development efforts should initially focus on the most affected areas.
Keywords: Imperata grassland, slash-and-burn cultivation, land use intensification, remote sensing, supervised image classification, GIS
I Introduction
Imperata cylindrica is one of the most dominant, competitive, and difficult weeds to control in the humid and sub-humid tropics of Asia, West Africa, and Latin America. There may be as much as 35 million hectares of Imperata grassland (IGL) in Asia, about 24.7 million hectares of which is in Southeast Asia (Garrity et al. 1997). Common names for Imperata are nya kha (Laos and Thailand), thetke (Myanmar), co tranh (Vietnam), alang alang (Indonesia), lalang (Malaysia), cogon (Philippines), illuk (Sri Lanka), and speargrass.
Links between slash-and-burn cultivation (SBC), also called “shifting cultivation,” and the formation of IGLs were well understood in Indonesia in the 1930s (Van Noordwijk et al. 1997). IGLs have developed mostly on former forestlands after repeated logging and subsequent treatment by fire, e.g., in shifting cultivation (Eussen and Wirjahardja 1973; Seavoy 1975; Suryatna and McIntosh 1980).
Shifting cultivation is probably the oldest farming system, and its practice is remarkably similar throughout the humid tropics (Nye and Greenland 1960). Traditionally, farmers slashed and burned a hectare or so of primary or secondary forest, grew food crops in polyculture for one or more years, and abandoned the land to secondary forest regrowth for 20 to 40 years, then repeated the cycle (Sanchez et al. 2005). This traditional shifting cultivation—with short cropping periods and long secondary forest fallow periods —is now rare, practiced primarily by indigenous communities disconnected from the market economy. It is socially and environmentally sustainable (Thrupp et al. 1997), although at low levels of agricultural productivity and at human population densities of less than 30 people per square kilometer (Boserup 1965).
When population pressure exceeds a critical density—that varies with agro-ecological zones and inherent soil fertility—traditional shifting cultivation is replaced by a variety of other agricultural practices that still involve clearing by slash-and-burn methods. Pedro Sanchez et al. (2005) suggest that the loosely used terminology be specified as follows: “shifting cultivation” refers to the traditional long-fallow rotational system, while “slash-and-burn” refers to other farming systems characterized by slash-and-burn clearing, short-term fallows, or no fallows at all. Both systems include the shortened fallow-food crop systems and the establishment of tree-based systems such as complex agroforestry, simple agroforestry, or monoculture tree crop plantations. Many of these systems are still rotational to some degree, with occasional slash-and-burn clearing when the productivity of the system declines.
The vegetative fallow phase restores carbon and nutrient stocks in the biomass, improves soil physical properties, and suppresses weeds (Nye and Greenland 1960; Sanchez 1976; Andriesse and Schelhaas 1987; Roder et al. 1997; Watanabe et al. 2004). With the reduction of fallow periods to less than 10 years, and more commonly less than 5 years, the fallow vegetation is incapable of restoring sufficient nutrients in the biomass and suppressing weeds by shading for the subsequent cropping phase. Unlike shifting cultivation, slash-and-burn systems have less vegetative cover and often have exposed, compacted soils that increase water runoff and soil erosion rates (Lal et al. 1986). This change in vegetation and soil structure caused by shortened fallows results in systems with declining productivity, depending more and more on less and less fallow biomass. The frequent use of fire is replacing native species with exotic, aggressive ones and favoring grasses over woody species, creating treeless landscapes that have minimal productive and ecological value (Styger et al. 2007). In some cases, the systems reach a point at which the trees are replaced by other, highly degraded systems such as IGLs in Southeast Asia and West Africa (Garrity 1997).
Ecologically, Imperata infestation is an interrupted developmental phase in the ecosystem development process. An interrupted ecosystem, or a blocked phase, inhibits the processes leading to the next developmental phase. The blocked phase can be based on the absence of viable stumps, depletion of seed banks, and reduced inflow of seed from the surrounding landscape and/or soil conditions that do not allow for rapid growth of tree seedlings to a stage where they can replace the grass (Murniati 2002). IGL has many disadvantages compared to the forest in terms of biodiversity, total biomass for the maintenance of soil fertility, and carbon capture, and as a producer of useful materials for human populations. Therefore, efforts toward more productive land uses will contribute to economic growth, environmental protection, and rural poverty alleviation.
In Lao PDR, IGL has been estimated at about 0.8–1 million hectares (Charoenwatana 1989; Garrity et al. 1997). This Imperata land covers about 3% to 4% of the country’s territory, which is equivalent to the current cultivated land area of the country. Although there has been extensive research and development focused toward making better use of IGLs in the region, limited information is available in Laos. In fact, the IGLs exist—and are expected to increase—as a result of shortened fallow periods driven by increased population density and shifting cultivation stabilization policies in many upland areas. To rehabilitate land infested by Imperata, it is very important to first understand the latter’s area, distribution, and characteristics. This study was undertaken (1) to map and estimate the area of IGL in Nambak District of Luang Prabang province in northern Laos, and (2) to describe the existing IGL in relation to its spatial distribution and relationships with other land uses, and its importance for upland development using Remote Sensing (RS) and Geographic Information System (GIS) technologies. The findings of the study will not only help improve the understanding of IGL dynamics in the study area, but also provide valuable information to policy makers and resource managers to design and develop more integrated research and development aimed at better use of natural resources in the uplands of Laos.
II Methods
II-1 Study Area
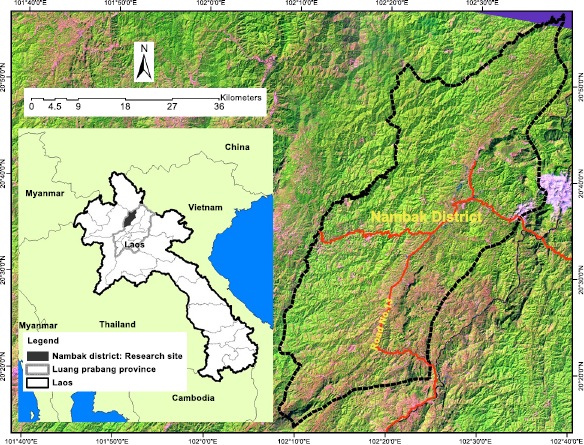
The study area is situated in Nambak District, Luang Prabang province, in northern Laos (Fig. 1), about 120 km northwest of the provincial capital. Geographically, it is located between latitudes 20°58’N and 21°15’N and longitudes 102°09’E and 102°37’E. The district covers an area of about 200,000 hectares, with a total population of about 65,400 inhabitants in 83 villages.
Nambak District represents a typical mountainous district of northern Laos. The district has a tropical climate with mild winters during October–March. Average monthly temperatures range from 20°C to 31°C, and annual rainfall ranges from 1,700 mm to 1,900 mm. Flat alluvial land area with an altitude of less than 600 m accounts for less than a quarter, while low hills and mountains with an altitude of 600–1,000 m account for more than half of the territory. Areas with an elevation of more than 1,000 m form approximately one quarter of the district area (RDCC1 2002). SBC agriculture continues to be the main land use system by area, although the areas of upland rice have been reduced substantially in recent years (Personal communication with district officers). Local farmers are adapting themselves to cope with reduced fallow periods as a result of shifting cultivation stabilization policies promoted by the local authorities and increased population pressure.
II-2 Remotely Sensed Data
Landsat-5 TM imagery was chosen for this study. The image covering Nambak District (Fig. 1) was acquired in February 2010. The scene center location (lat/long) is 20.626/102.381 degrees, path/row – 129/46, output bands – 7, and pixel spacing – 25×25 m. The Landsat data was supplied in geo-rectified form and projected to the UTM zone 48N with the coordinate system referenced on the WGS 84 datum.
February was expected to be the most suitable period of the year for Imperata land cover detection by the sensor, because wet season crops in the uplands were completely harvested and burning operations for the next cropping had not yet started, although slashing may have been almost finished in many areas.
II-3 Land Use/Land Cover Classes
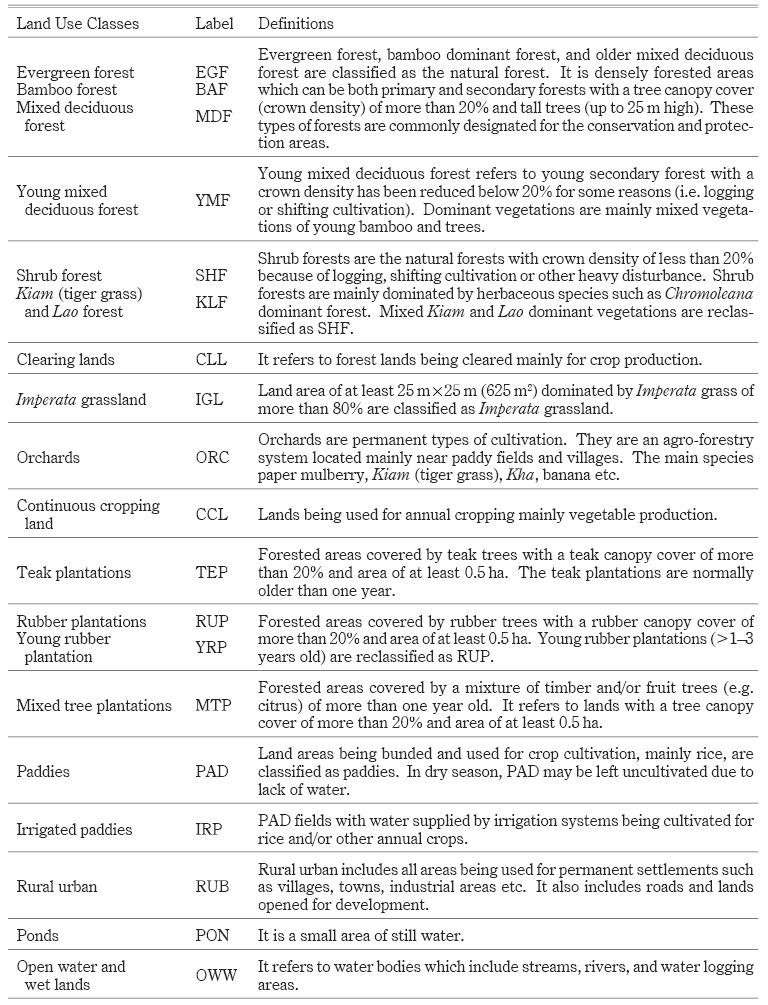
For this research, land cover/land use categories or classes were defined after consultation with local communities and observation in the fields during ground truth data collection. Differences in vegetation covers and land use practices were the main criteria used to distinguish between land use classes. A total of 19 land covers/land uses were identified for the study area (Appendix Table 1).
II-4 Ground Truth Data Collection
The supervised image classification method requires ground truth data to help identify information classes (land use categories), which are then used by the software to determine the spectral classes that represent them. In the fields, the land use/land cover classes indicated in Appendix Table 1 were cautiously observed for their characteristics, such as species, age, density, and land use types. A total of 275 points of the existing land covers of about 0.5 hectares were collected using a Global Positioning System (GPS) during November–December 2010, about nine months after the Landsat-5 TM data was obtained.
II-5 Image Pre-processing
ERDAS IMAGINE 8.4 software was used as a tool to correct degraded and/or distorted image data to create a more faithful representation of the original Landsat imagery. The single-band images of Landsat-5 TM were initially combined into a composite map and enhanced with false color of bands 5:4:3. The images were also enhanced using a haze-reduction function to remove the cloud cover. Finally, the image was subset for the study area and used for the image classification process described below.
II-6 Image Classification
In this study, the supervised classification method, using the Maximum Likelihood Classifier (MLC), was used for image classification. The MLC is the most widely employed classification algorithm for digital image classification (Bolstad and Lillesand 1991; Forghani et al. 2007).
The ground truth data of 275 points of 19 land use types were imported onto the Landsat image for creating the training areas, from which numerical signatures for each of the defined land use/land cover classes were assigned using Signature Editor Tools in ERDAS IMAGINE 8.4 software. In addition, a high-resolution satellite image from Google Earth was used to help distinguish the features of different land uses with respect to their tones, shapes, sizes, patterns, textures, and associations. After closely relating the Landsat imagery with Google satellite images, in addition to the 19 land uses from the ground truth data 2 more land uses were identified: clouds and shadow areas. After the signatures for each land use were identified, image classification using MLC was performed. A total of 22 land use classes, including 1 class of unclassified area, were generated. Finally, the resulting classification data were assessed for their mapping accuracy.
II-7 Image Post-classification
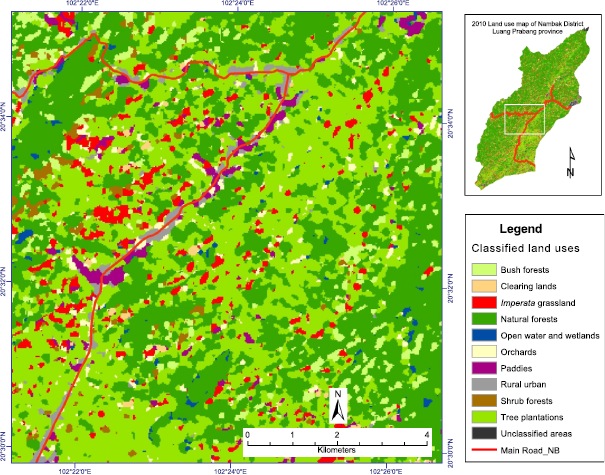
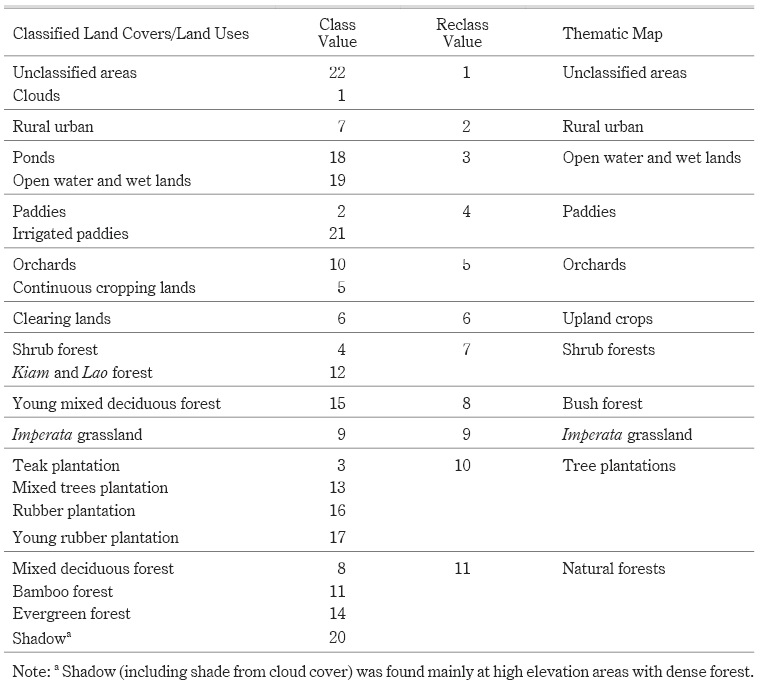
Following the mapping accuracy assessment, the classified image was generalized using the fuzzy convolution function with a 5×5 moving window in order to eliminate unnecessary details and extract a single or a small group of misclassified cells for a more general spatial analysis. The generalized image of 22 land uses was then reclassified into a thematic map consisting of 11 land use classes (Appendix Table 2), which is actually a 2010 land use map of Nambak District (Fig. 2). This resulting thematic map was used for the spatial analysis discussed below.
II-8 Spatial Analysis
In order to better understand the spatial distribution of IGLs and their relationship with other land uses in the study area, a 10×10 km grid map in shapefile format was created using the Data Management Tool in ArcGIS 9.2. The generated grid map consists of 30 grids, with each grid cell representing 100 km2. The grid map was overlaid on the thematic map, from which land uses for each grid were extracted using the clipping function (Fig. 3); and then the areas and land use intensity were calculated. Based on this analysis, the Imperata-infested zones were classified into low, moderate, and high intensity. A purposive random sampling procedure was used to select the 15 odd-numbered grids for correlation analysis to statistically test the null hypothesis that there was no relationship between the IGL area and some of the main land uses. The sampling resulted in 15 odd-numbered grids: 1, 3, 5, 7, 9, 11, 13, 15, 17, 19, 21, 23, 25, 27, and 29 (Fig. 3).
III Results and Discussion
III-1 Land Use/Land Cover Mapping
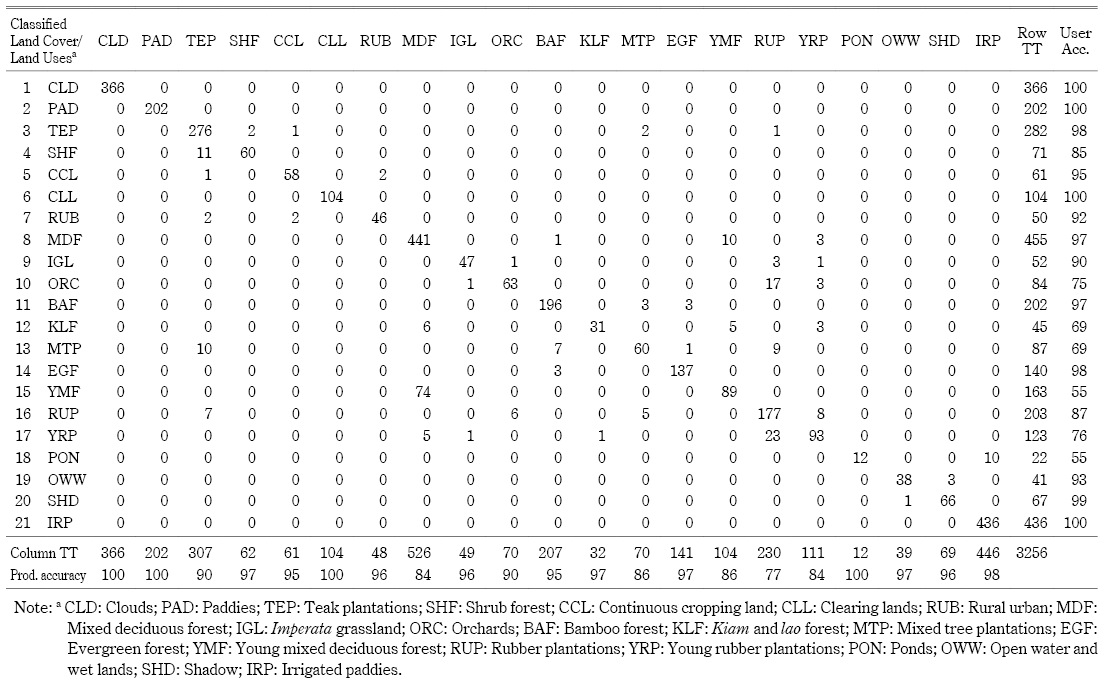
A total of 19 land use/land cover classes were identified for the study area during the field visits for ground truth data collection, and three land cover classes (cloud, shadow, and unclassified areas) were identified during the image classification process. Appendix Table 3 was used to determine the quality/accuracy of the classified data derived from the MLC algorithm on Landsat-5 TM dated February 2010. The columns represent reference data (i.e., ground truth) and suggest how many pixels are classified correctly by the proposed algorithm. The overall accuracy was estimated at 92.1%, which is well above the ≥85% regarded as acceptable in the literature. The kappa statistic was calculated to be 91.3%, which corresponds to strong agreement, based on ≥80%, 40–80%, and <40% for strong, moderate, and poor agreement respectively (Congalton and Green 1999).
IGL, which was the main objective of this study, was mapped with high accuracy: out of a total of 49 IGL pixels, 47 pixels (96%) were correctly classified into IGL and 2 pixels (4%) were misclassified as orchards and young rubber plantations. Rubber plantations achieved the lowest mapping accuracy: out of a total of 230 rubber plantation pixels, 177 pixels (77%) were classified correctly; and 1, 3, 17, 9, and 23 pixels were misclassified as teak plantations, IGL, orchards, mixed tree plantations, and young rubber plantations respectively (Appendix Table 3).
The classified land uses with lower mapping accuracy (<90%) were mixed deciduous forest, mixed tree plantations, young mixed deciduous forest, rubber plantations, and young rubber plantations. Misclassification of these existing land use classes was expected from the effects of mixed vegetation with unclear boundaries, topography, and soil conditions of particular land uses. Increased reference data (ground truth) would help improve mapping accuracy.
Nambak District has a relatively large area of forest reserves. Natural forest, which includes bamboo-dominated forest, mixed deciduous forest, and evergreen forest, is the most important land use, accounting for 59% (115,798 hectares) of the district area. Other forestlands, including orchards, bush and shrub forest, and tree plantations, account for 33% (64,348 hectares). Annual cropping area, including upland crops (clearing lands) and paddy, accounts for 2.8% (5,356 hectares). IGL occupies 2.5% (4,878 hectares). Urban land covers the smallest area: about 1% or 2,008 hectares (Table 1 and Fig. 2). The land uses were highly variable in patch sizes, with CVs ranging from 171% to 5,367% (Table 1 and Fig. 2). This situation is common in mountainous areas of northern Laos, due to the variability in topography and soils.

III-2 Imperata Grasslands in Nambak District: Area, Distribution, and Characteristics
The current IGL in Nambak District can be characterized as a “micro-grassland,” with most patch sizes being less than half a hectare, distributed throughout the study area. Large fields of 30 hectares are not common. As evidenced during our field visits, the Imperata fields were seen within individual fields and/or across fields in tree plantations, orchards, fallow lands, and upland cropping fields. Due to small field size, the IGLs in the study area could be managed mainly by local farmers and communities. Based on infestation level, IGL in Nambak District was classified into three zones.
Zone I is located in the northeast and northwest of the district (Fig. 3), occupying an area of 52,318 hectares or 27% of the district area. In this zone, IGL accounts for 0.6% (308 hectares) of the total area of the zone or 6.3% of the total IGL area in the district. This zone has larger areas of natural and bush forests—73.1% and 11.7%, as compared to 65.3% and 6.9% in Zone II, 42.5% and 4.9% in Zone III, and 59% and 7.5% in the district (Table 2). There is less land use intensification, with 7.5%, 1.0%, 0.7%, and 0.4% of the total area being used for tree plantations, paddies, orchards, and upland crops respectively. Zone I was classified as the least Imperata infested zone or an area with a low level of land use intensification but rich in natural forest reserves (Table 3).
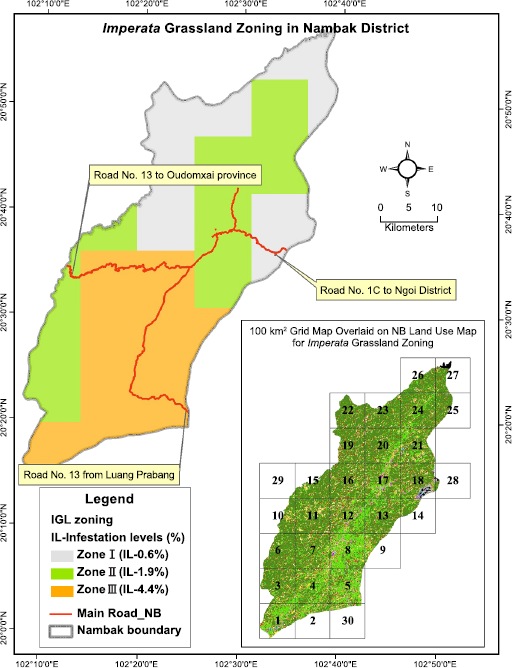
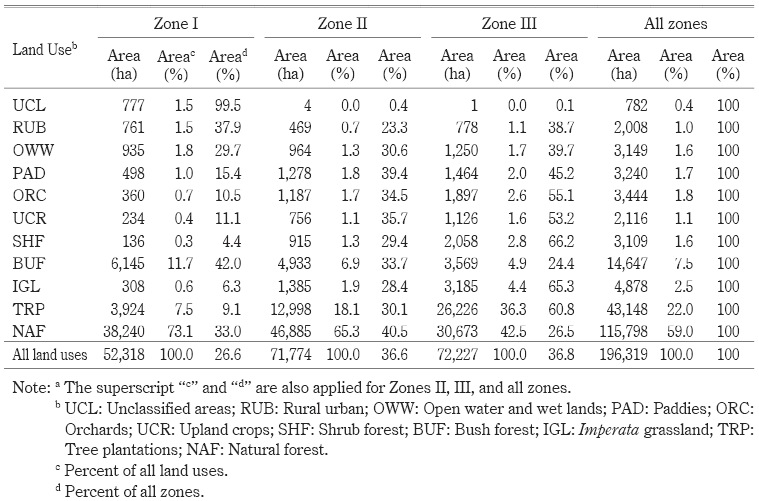
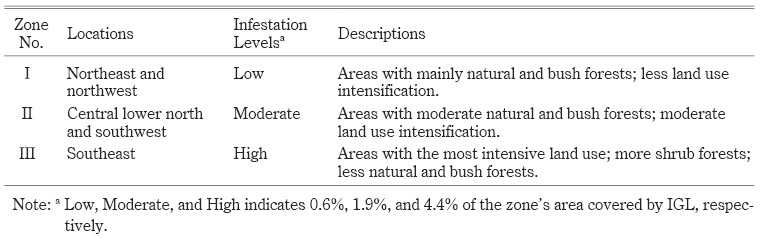
Zone II is located in the central lower north and the southwest and occupies an area of 71,774 hectares or about 37% of the district area. In this zone, IGL accounts for 1.9% (1,385 hectares) of the total area of the zone or 28.4% of the total IGL area in the district. This zone has larger areas of tree plantations, paddies, orchards, and upland crops—18.1%, 1.8%, 1.7%, and 1.1% respectively—as compared to Zone I. This part was classified as a moderate Imperata infested zone, with moderate intensive land use and moderate natural forest reserves.
Zone III is located in the southeast of the district, along National Road No. 13 from Luang Prabang to Oudomxai province, and occupies an area of 72,227 hectares or 37% of the district area. IGL in this zone takes up 4.4% (3,185 hectares) of the total area of the zone or 65.3% of the total IGL area in the district. This zone has the largest areas of tree plantations, orchards, paddies, and upland crops—36.3%, 2.6%, 2.0%, and 1.6% respectively—as compared to Zone I and Zone II. This part was classified as the most Imperata infested area in Nambak District, with the highest land use intensification, largest areas of degraded forest, and less natural forest reserves.
III-3 Implications for Slash-and-Burn Cultivation
Information about areas planted with crops under SBC was not available from local authorities, although the SBC method is widely practiced in the study area. While information on crop species and areas planted to each crop was available, it was unclear whether the crops were grown under the SBC system. As a result, it was difficult to estimate the crop areas specific to SBC based on the available crop data. Remote sensing was used as a means of quickly identifying and delineating various land use/land cover types, a task that would be difficult and time consuming using traditional ground surveys. For this study, Landsat-5 TM of February 2010 was used. Ground truth data collection on land uses was conducted during November–December of the same year. Mapping results reveal that in 2010 about 2,116 hectares of forestlands were cleared (Fig. 2). Based on this data, the area of upland crop under the SBC type of land use was estimated (Table 1 and Appendix Table 2). The results show that the upland crop area was considerably less than the crop area under tree plantations, orchards, and paddies, indicating that shifting cultivation stabilization efforts on the part of local authorities were successful in reducing SBC in the study area.
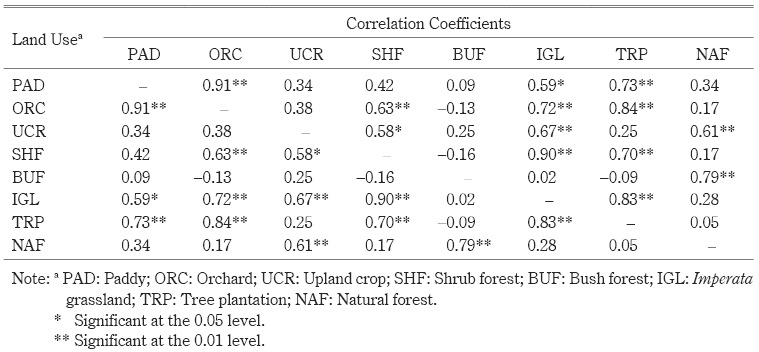
Correlation analysis reveals that changes in the upland crop area have no relationship with the area of tree plantations, orchards, or paddies but are strongly correlated with the area of IGL, natural forest, and shrub forest. The results also show that IGL is positively correlated with orchards, upland crops, shrub forest, and tree plantations and has some association with paddies (Table 4). This indicates that an increase in IGL areas is closely correlated with—or linked to—an increase in the areas of agricultural land use intensification. As a result, we suggest that improper SBC intensification into more permanent crop production systems is a major cause of Imperata infestation in the upland areas.
IV Conclusion
Satellite image classification results show that 19 land uses/land covers of 196,319 hectares of Nambak District of Luang Prabang Province in northern Laos were mapped with an overall accuracy of 92.1% and a kappa statistic of 91.3%. Imperata grassland (IGL) achieved more than 90% mapping accuracy.
The current IGL was estimated at about 4,878 hectares or 2.5% of the Nambak District area and characterized as a “micro-grassland,” with most patch sizes being less than half a hectare, distributed within individual fields and/or across fields of all types of land uses throughout the district area.
Based on Imperata infestation level, the study area was classified into three zones. About 37% of the district area in the southeastern part was identified as the most Imperata infested zone, characterized as the area with the most intensive land use, larger areas of degraded forests, and less natural forest reserves as compared to the other two zones in different parts of Nambak District. The study results suggest that improper SBC intensification into more permanent crop production systems is a major cause of Imperata infestation in the upland areas. While there has been a reduction in SBC area as a result of shifting cultivation stabilization policies, the spread of IGL can be a threat to the productivity and sustainability of traditional SBC systems and already intensified land use systems. In order to further utilize land resources more effectively to promote economic growth while maintaining the environment, government intervention is indispensable; development efforts should initially focus on the most affected areas. We have demonstrated the potential use of geoinformation technology (remote sensing and GIS) with ground truth data as the basis of area informatics data sets that can be applied in other area studies in Laos.
Accepted: April 11, 2012
Acknowledgments
We express our sincere thanks to the Agriculture and Forestry Office of Luang Prabang province, the District Agriculture and Forestry Office of Nambak, and local community leaders and farmers in Nambak District for their support in our fieldwork. This study received financial support from the Thailand Research Fund under CLMV-T DSS Graduate Degree Program Research Initiative: 1st Phase (Contract No. RDG52O0003-LV01).
References
Andriesse, J. P.; and Schelhaas, R. M. 1987. A Monitoring Study of Nutrient Cycles in Soils Used for Shifting Cultivation under Various Climatic Conditions in Tropical Asia: II. Nutrient Stores in Biomass and Soil—Results of Baseline Studies. Agriculture Ecosystems and Environment 19(4): 285–310.
Bolstad, P. V.; and Lillesand, T. 1991. Rapid Maximum Likelihood Classification. Photogrammetric Engineering and Remote Sensing 57(1): 67–74.
Boserup, E. 1965. The Conditions of Agricultural Growth: The Economics of Agrarian Change under Population Pressure. Chicago: Aldine.
Charoenwatana, T. 1989. Lao People’s Democratic Republic: Agroecosystems. Proceedings of the SUAN-EAPI Workshop on Lao Agroecosystems, Vientiane, July 31–August 3, 1989.
Congalton, R. G.; and Green, K. 1999. Assessing the Accuracy of Remotely Sensed Data: Principles and Practices. Boca Raton: Lewis Publishers.
Eussen, J. H. H.; and Wirjahardja, S. 1973. Studies of an Alang-alang (Imperata cylindrica (L.) Beauv.) Vegetation. BIOTROP 6: 2–24.
Forghani, A.; Cechet, B.; and Nadimpalli, K. 2007. Object-based Classification of Multi-sensor Optical Imagery to Generate Terrain Surface Roughness Information for Input to Wind Risk Exposure Simulation. Proceedings of the IEEE International Geoscience and Remote Sensing Symposium (IGARSS), Barcelona, July 23–27, 2007, pp. 1–6.
Garrity, D. P., ed. 1997. Agroforestry Innovations for Imperata Grassland Rehabilitation. Dordrecht: Kluwer Academic Publishers.
Garrity, D. P.; Soekardi, M.; Van Noordwijk, M.; De La Cruz, R.; Pathak, P. S.; Gunasena, H. P. M.; Van So, N.; Huijun, G.; and Majid, N. M. 1997. The Imperata Grassland of Tropical Asia: Area, Distribution, and Typology. Agroforestry Systems 36: 3–29.
Lal, R.; Sanchez, P. A.; and Cummings, R. W., eds. 1986. Land Clearing and Development in the Tropics. Rotterdam: Balkema.
Murniati. 2002. From Imperata cylindrica Grasslands to Productive Agroforestry. Thesis, Wageningen University, Netherlands.
Nye, P. H.; and Greenland, D. J. 1960. Commonwealth Bureau of Soils Technical Communication, No. 51. Farnham: Commonwealth Agricultural Bureau.
Roder, W.; Phengchanh, S.; and Keoboualapha, B. 1997. Weeds in Slash-and-Burn Rice Fields in Northern Laos. Weed Research 37(2): 111–119.
Rural Development and Construction Company No. 1 (RDCC1). 2002. Orientations for Socio-economic Development in Nambak District Period 2002-2010. Agriculture and Rural Development Ministry, Vietnam.
Sanchez, P. A. 1976. Properties and Management of Soils in the Tropics. New York: John Wiley and Sons.
Sanchez, Pedro A.; Palm, Cheryl A.; Vosti, Stephen A.; Tomich, Thomas P.; and Kasyoki, Joyce. 2005. Alternatives to Slash and Burn: Challenge and Approaches of an International Consortium. In Slash-and-Burn Agriculture: The Search for Alternatives, edited by Cheryl A. Palm, Stephen A. Vosti, Pedro A. Sanchez, and Polly J. Ericksen, pp. 3–37. New York: Columbia University Press.
Seavoy, R. E. 1975. The Origin of Tropical Grasslands in Kalimantan, Indonesia. Journal of Tropical Geography 40: 48–52.
Styger, E.; Rakotondramasy, H. M.; Pfeffer, M. J.; Fernandes, E. C. M.; and Bates, D. M. 2007. Influence of Slash-and-Burn Farming Practices on Fallow Succession and Land Degradation in the Rainforest Region of Madagascar. Agriculture Ecosystems and Environment 119: 257–269.
Suryatna, E. S.; and McIntosh, J. L. 1980. Food Crops Production and Control of Imperata cylindrica (L.) Beauv. on Small Farms. Proceedings of BIOTROP Workshop on Alang alang, Bogor, July 27–29, 1976. BIOTROP Special Publication No. 5, pp. 135–147.
Thrupp, L. A.; Hecht, S. B.; and Browder, J. O. 1997. The Diversity and Dynamics of Shifting Cultivation: Myths, Realities, and Policy Implications. Washington, DC: World Resources Institute.
Van Noordwijk, M.; Hairiah, K.; Partoharjono, S.; Labios, R. V.; and Garrity, D. P. 1997. Food-Crop-Based Production Systems as Sustainable Alternatives for Imperata Grasslands? Agroforestry Systems 36: 55–82.
Watanabe, E.; Sakurai, K.; Okabayashi, Y.; Nouanthasing, L.; and Chanphengxay, A. 2004. Soil Fertility and Farming Systems in a Slash and Burn Cultivation Area of Northern Laos. Southeast Asian Studies 41(4): 519–537.
Appendix Table 1 Descriptions of the Main Land Uses/Land Covers in Nambak District, Luang Prabang Province, Northern Lao PDR
Appendix Table 3 Error Matrix of Landsat-5 TM Image Classification of Nambak District Using MLC (Overall Accuracy=92.1%; Kappa Statistic=91.3%)
![]()
