![]()
Contents>> Vol. 6, No. 2
Household Structure and Sources of Income in a Rice-Growing Village in Northeast Thailand
Shirai Yuko* and A. Terry Rambo**
* 白井裕子, Program on System Approaches in Agriculture, Faculty of Agriculture, Khon Kaen University, Khon Kaen 40002, Thailand
Corresponding author’s e-mail: yuko.faa[at]gmail.com
** Program on System Approaches in Agriculture, Faculty of Agriculture, Khon Kaen University, Khon Kaen 40002, Thailand; East-West Center, Honolulu, Hawaii 96848-1601, USA
DOI: 10.20495/seas.6.2_275
As part of the agrarian transformation in Northeast Thailand, major changes have been occurring in the size, structure, and sources of income of rural households. This study, which is based on a survey of 303 households in a rice-growing village in Khon Kaen Province in Northeast Thailand, presents a detailed picture of contemporary rural households. Households have decreased in size while becoming more structurally diverse. Nuclear households, which were the most common structural type in the past, are increasingly being replaced by extended, skipped generation, and truncated households. Multiple factors, including the increased opportunity for earning income from local non-farm employment, provision of services within the village, prolongation of people’s life spans, increased education levels, delayed age of marriage, and an increase in the number of people who never marry, have contributed to these changes. At the same time as they are becoming structurally more diverse, rural households have become increasingly dependent on non-agricultural sources of income. Even truncated households, which are the most reliant on agricultural income of any structural type, derive only one-third of their total income from farming. Non-agricultural income sources, which include local non-farm employment, self-employment, remittances, and government support and pensions, are of growing importance. Many households are in debt, with two-thirds of skipped generation households having debts exceeding 100% of their annual net income. Government rural development and poverty reduction policies and programs intended to improve the social and economic situation of people in the Northeast need to take the changed nature of their households into account if they are to achieve their desired results.
Keywords: household composition, local non-farm employment, remittances, rural livelihoods
Introduction
As part of the ongoing agrarian transformation in Northeast Thailand (commonly called “Isan”), major changes of rural households have been occurring. For instance, the average size of households has decreased, and nuclear households, formerly the predominant type, have declined in number, and new household types have been emerging. Associated with changes in household structure are changes in sources of income, which are becoming increasingly diversified, with a decline in the contribution made by agriculture and a growing share of income coming from non-agricultural sources. So marked is this shift that contemporary Isan agricultural households have been called “part-time farmers” (Takeuchi 2004; Rigg 2005; Grandstaff et al. 2008).
Although many of these broad changes in rural households and their sources of income have been discussed by other researchers at a rather general level (Smith 1978; Grandstaff et al. 2008; Rigg and Salamanca 2009; 2011; Keyes 2010; Rigg et al. 2012; Chawanote and Barrett 2013), no detailed descriptions of the nature of changes occurring at the village level have been published. Moreover, many members of the general public, as well as academics, journalists, and policy makers, continue to cling to the old stereotype of rural Isan villagers as poor rainfed rice farmers and have not yet perceived the extent to which rural society and economy in the region have changed. Understanding the reality of rural people’s livelihoods in Isan is essential in order to formulate more realistic development policies that will truly serve the interests of local people in the region. Therefore, we undertook this study in a village in Khon Kaen Province in Northeast Thailand in order to describe the current structure of rural households and identify their sources of income. In this paper, we seek to: (1) describe the composition of rural households and classify them into structural types; (2) examine changes that have occurred in the size and types of households over the past 50 years; (3) examine the relationship of household structures and age distribution, types of livelihoods, and agricultural activities; (4) identify the income sources of different types of households; and (5) examine the relationship of household structures with levels of income and debt.
Overview of Nong Ben Village
This research was carried out in Nong Ben village (16°37′12″N, 102°49′59″E) in Khon Kaen Province. The village is located approximately 20 kilometers northeast of Khon Kaen Municipality along National Highway No. 2 (Fig. 1). Nong Ben village is one of 10 villages in Non Thon Subdistrict (tambol). Nong Ben was a single village (Muban) until 2006, when it was divided into two administrative villages, each with its own headman.
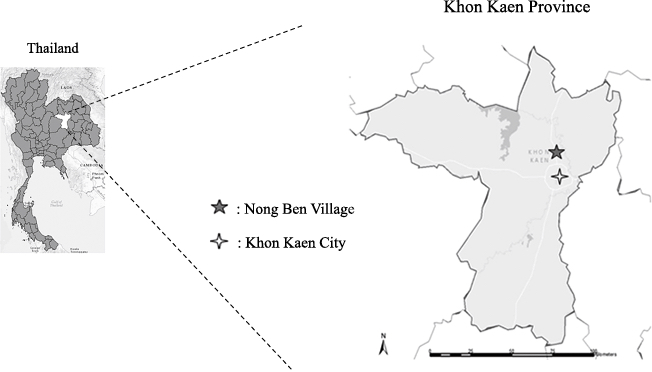
Fig. 1 The Location of Nong Ben Village, Non Thon Subdistrict, Khon Kaen Province
The village area of Nong Ben is about 6,291 rai (1,007 ha) (Sunantha 2002). The total agricultural area was about 5,039 rai (806 ha) in 2005 but had declined to around 4,111 rai (658 ha) in 2011. Water for irrigation is supplied by a canal from the Ubolratana dam in Nam Phong District, which is around 30 kilometers from the village. After irrigation first came to the village in 1968, the household economy of the villagers changed dramatically because it became possible to plant a second rice crop in the dry season and to cultivate other valuable crops such as flowers and vegetables.
There are three different agricultural land-use in the village: (1) rainfed upland cash crop fields (cassava, sugarcane, and rubber); (2) irrigated fields used to grow rice and other crops (e.g., flowers and vegetables); and (3) rainfed paddy fields. The total area of paddy fields in 2002 was about 3,019 rai (483 ha), which had declined to 2,501 rai (400 ha) in 2011. In 2006, about 53% of village households had only irrigated paddy fields, 11% had only rainfed paddy fields, and 36% had both types of paddy fields (Shirai et al. 2007). The villagers plant glutinous rice (RD6 variety), mostly for self-consumption, and jasmine rice (KDML105 variety) for sale.
Nong Ben had a de facto population of 1,189 persons and 303 households in 2013. Its inhabitants belong to the Thai-Lao ethnic group. The majority (81.1%) of households are engaged in agriculture, of which around 96.7% cultivate rice; 39.8% cultivate field crops such as cassava, sugarcane, and rubber; and another 21.9% cultivate other crops such as flowers and vegetables. According to our village survey in 2006 (ibid.), about 70% of village households raised cattle and only three households raised buffalo, but these numbers had declined by 2013, when only 14.1% of village households still raised any kind of livestock. Most households (79.2%) are owners of agricultural land and basically manage their lands by themselves, while 11.2% of households have no agricultural land and do not engage in any agricultural activities. In 2013, 27.6% of the total labor force in the village had some form of local non-farm employment such as casual hire wage work or regular wage work in factories near the village or in the service sector in the city of Khon Kaen.
The spread of farm mechanization that has been occurring throughout Isan can be observed also in Nong Ben. However, only 6.6% of households own large modern farm machines such as four-wheel tractors and combine harvesters, and the owners hire out their machines together with drivers to other villagers. Most villagers now hire agricultural machines to plow their paddy fields and harvest the rice.
Methodology
Data collection was carried out in the village in April 2013. At the beginning of the study, group discussions were conducted several times with around 20 villagers participating each time. Topics included village boundaries, land-use and history, the annual cycle of agricultural and cultural activities, previous and current situations of non-farm employment, use of remittances, and people’s livelihoods both in the past and in the present. Secondary data for the village, such as area of agricultural land, types of agricultural crops, and household registration data—including names and ages of all household members—were obtained from several government offices in Khon Kaen, including the Provincial Office, Non Thon Subdistrict Office, Provincial Agricultural Office, and Community Development Office.
Detailed information on the composition and sources of income of each of the 303 households residing in the village were obtained in multiple extended interviews with the village headmen and confirmed when necessary by checking with the individual households. Data collected included the household members who stay together; household members who migrant to other places and locations they migrate; sex, age, education level, marital status, occupation, and relationship of all household members, including out-migrants; type of household income sources (both agricultural and non-agricultural); area of agricultural land they own and land-use, and types of agricultural activities. This information was used to classify the households that were used to select the sample households for a detailed survey.
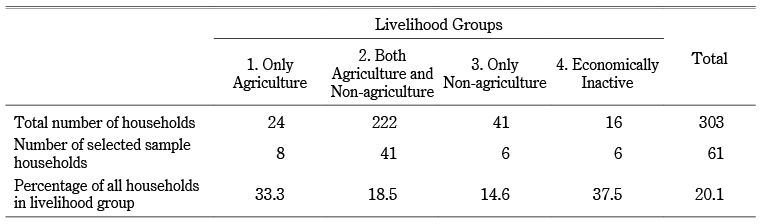
The 303 village households were divided into four groups according to their types of livelihood: (1) only agriculture (24 households), (2) both agriculture and non-agriculture (222 households), (3) only non-agriculture (41 households), and (4) economically inactive (16 households). Random samples of households were selected from each group. Although the initial plan was to interview 20% of the households in each group, some groups had relatively small numbers of households so all of the households that were available for interviewing were included in the survey (Table 1).
Table 1 Number of Sample Households from Different Livelihood Groups
Each sample household was interviewed to obtain detailed information about the household members who stay together; household members who migrant to other places and locations they migrate; sex, age, education level, occupation, marital status and relationship of all household members, including out-migrants; amount of remittances; types of agricultural and non-agricultural activities; engagement in agricultural and non-agricultural employment; area of agricultural land they own and land-use; ownership of agricultural tools including farm machines; household assets such as a TV or motor vehicle; monthly or annual household expenditure and individual and household cash income from agricultural and non-agricultural activities; and amount and reason of debt. Interviews with the sample households were carried out on May 5–11, 2013.
All data were entered into an Excel database. SPSS version 21 was used for analysis of data.
Household Composition
Households in Nong Ben are relatively small, with an average size of 3.9 persons in 2013, which is quite similar to the average size of households in Northeast Thailand of 3.5 individuals in 2010 (National Statistics Office of Thailand 2010). Although we do not have historical data on household size in Nong Ben, data from earlier village studies in several provinces in Isan show that the mean size of rural households has been declining since the 1960s (Table 2).
Table 2 Changes over the Past 50 Years in Mean Household Size and the Frequency of Occurrence of Different Types of Household Structures in Rural Villages in Northeast Thailand

The 303 households in Nong Ben can be classified into four structural types: nuclear family household, extended family household, skipped generation family household, and truncated family household. Henceforth, these types are referred to as “nuclear household,” “extended household,” “skipped generation household,” and “truncated household” respectively. These types were derived from a classification system devised by Ethel Nurge (1965) as modified by A. Terry Rambo and Neil Jamieson (1973). Nuclear households were defined by G. P. Murdock as typically consisting of “a married man and woman with their offspring” (Murdock 1949, 1). Households with only a single spouse present to care for the children are also included in the nuclear household type in this study (Funahashi 2006). Extended households can include both vertically and horizontally related family members. The most common vertical extended type is made up of a married couple, their children, and one or more of the parents of one of the spouses. Skipped generation households are composed of elderly persons, usually grandparents, and one or more of their own or someone else’s grandchildren. Truncated households are composed of “isolated individuals such as a widow or widower or an elderly married couple living alone with no children present” (Rambo and Jamieson 1973, 20). Fig. 2 presents diagrams of each of the structural types.
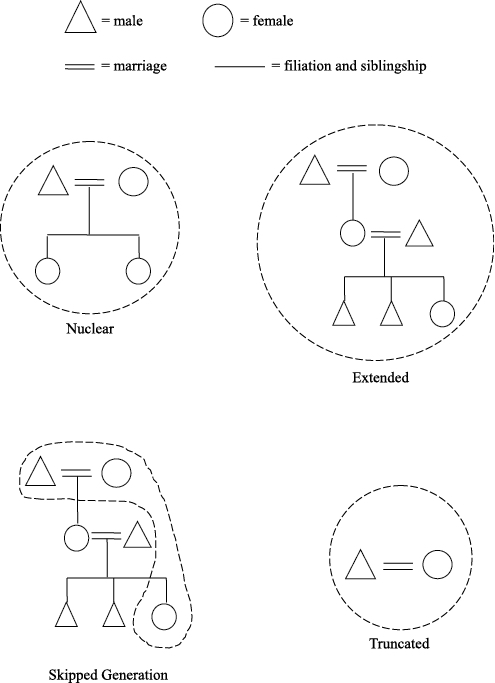
Fig. 2 Types of Household Structure in Nong Ben Village (The dashed lines surround household members who stay together under the same roof.)
Source: Modified from Hammel and Laslett (1974, 104).
The extended households are the dominant type of household in Nong Ben, with 40.3% of all households being of this type, followed by nuclear households (29.0%), truncated households (19.1%), and skipped generation households (11.6%). The rather large number of truncated households is noteworthy and it is probably the result of young people gaining higher education and taking non-farm jobs in the city rather than remaining with their parents in the village. The study by Mulubrhan Amare, Lena Hohfeld, Somchai Jitsuchon, and Hermann Waibel (2012) reported that migrants from Isan are generally more educated. As a result of such changes, rural households have become smaller and more fragmented.
Although longitudinal data are not available for Nong Ben, it is possible to compare the prevalence of different types of households at present with data on household types collected in earlier studies of similar rice-growing Isan villages in order to assess the extent to which household composition has changed over time (Table 2). Community studies in the 1960s in villages in Udon Thani, Mahasarakham, Khon Kaen, and Nakhon Ratchasima Provinces found that most households (>68%) were of the nuclear type (Lux 1961; Janlekha 1968; Keyes 1975; Mizuno 1981). A study of Don Daeng village in Khon Kaen Province in 1981 found that 64% of households were of the nuclear type, while a follow-up study in 2002 showed that the share of nuclear type households had declined to 43%. During the same period the share of extended type households increased from 29% to 40%. Other household types such as lone person households and elderly married couples living in their own separate households (which we classify as “truncated”) increased from 6% in 1981 to 12% in 2002 (Funahashi 2006). This is in agreement with the observation by Jonathan Rigg and Albert Salamanca (2009) that household structure in the Northeast has recently become more complex.
Multiple factors may have contributed to the decreasing prevalence of nuclear type households and the emergence of other types. Funahashi Kazuo (2006, 94) has suggested that Thai society might have a cultural predisposition toward diversity in the compositions of families, although he does not further develop this idea. In addition, expansion of the regional economy as a consequence of national economic development, which offered people more opportunities for local non-farm employment, thus reducing the need for young adults to migrate to other locales in search of employment, may have led to an increase in the number of extended households. The increase in the age of marriage and the rise in the number of individuals who never marry, both of which seem to be associated with increased education levels, may be possible factors contributing to the increased prevalence of non-nuclear type households. For instance, in cases where unmarried adults remain in the same house with their parents and married siblings, it becomes an extended type household, whereas in cases where unmarried adults live alone in separate houses, they become truncated type households.
Characteristics of Different Types of Households
Age Distribution of Members of Different Types of Households
There are clear differences in the age distributions of their members among different types of households. The survey of all 303 households in Nong Ben finds that nuclear households are composed mostly of working-age people between 18 and 59 years of age (70.1%), with 22% of their members being younger than 18 and 7.9% being 60 or older. The majority (56.5%) of members of extended households are also of working age, with 26.2% under 18 and 17.3% aged 60 or older. Skipped generation households have a much lower share of working-age members (37.3%) and larger shares of members under 18 (39.9%) and 60 or older (22.8%). In truncated households, 57% of members are of working age, 39% are 60 or older, and only 4% are under 18.
Types of Economic Activities of Different Types of Households
The 303 households in Nong Ben were classified into four types according to their economic activities: (1) do agriculture only; (2) do both agriculture and non-agriculture; (3) do non-agriculture only; and (4) are economically inactive (Table 1). Of all the households, 7.9% are engaged only in agriculture, 73.3% are engaged in both agricultural and non-agricultural activities, 13.5% are engaged only in non-agricultural activities, and 5.3% are economically inactive. This finding is similar to that of earlier studies in Don Daeng village that reported the increasing importance of non-farm income sources for village households: the share of households with members receiving regular salaries was only 2.3% in 1964 but had increased to 7.1% in 1981 and 22.7% in 2002 (Kuchiba 1990; Funahashi 2006). According to the survey of 61 sample households in Nong Ben, about 24% had members who received a monthly salary.
The types of economic activities vary according to the structure of households. Extended households are most likely (85.1%) to be engaged in both agricultural and non-agricultural activities, with equal shares (6.6%) of these households doing agriculture only and non-agriculture only, and 1.7% being economically inactive. Nuclear households have the next highest share (80.8%) doing both agricultural and non-agricultural activities, 15.9% doing only non-agriculture, 2.2% doing agriculture only, and 1.1% being economically inactive. Skipped generation households are mostly (68.7%) engaged in both agricultural and non-agricultural activities, with equal shares (11.4%) of the households engaged in only non-agricultural activities and economically inactive, and 8.5% doing only agricultural activities. Truncated households display a very different pattern of economic activities from other types of households, with only 39.6% doing both agricultural and non-agricultural activities, 25.9% doing only non-agricultural activities, 19% doing only agriculture, and 15.5% economically inactive. This may reflect the fact that truncated households have the highest share of people aged 60 years or older, who are more likely to have retired from active life but may continue to engage in part-time agriculture on their own farms. Thus, the differences in economic activities among the different types of households presented above may reflect differences in their age structures and education levels, with household types having higher proportions of younger and better-educated working-age members being more likely to engage in non-agricultural activities.
Types of Agricultural Activities of Different Types of Households
Although at least some households of each structural type are engaged in agricultural activities, they differ in the specific types of agricultural activities in which they engage. Extended households have the highest share engaged in cultivation of rice (89.3%), cultivation of cash crops (38.5%), cultivation of other crops (24.6%), and livestock raising (21.3%). Nuclear households have the second-highest level of involvement in cultivation of rice (79.5%), cultivation of cash crops (34.1%), cultivation of other crops (14.7%), and livestock raising (10.2%). Skipped generation households cultivate rice (77.1%), cultivate cash crops (31.4%), cultivate other crops (17.1%), and raise livestock (5.7%). Truncated households have the lowest engagement in cultivation of rice (55.2%), with 17.2% of households cultivate cash crops, 8.6% cultivate other crops, and 10.3% raising livestock.
The distinctions between the agricultural activities of the different types of households are more clearly revealed in data from the sample survey of 61 households. Extended households have the most diverse agricultural activities, including cultivation of rice, cassava, sugarcane, rubber, and other crops, and raising buffalo and swine. On the other hand, nuclear households engage in fewer kinds of agricultural activities, being limited to planting rice, cassava, rubber, and other crops. These differences do not appear to be related to differences in the size of landholdings but may reflect significant differences in the availability of labor in the different household types. The extended households have the largest average number of members (five persons per household), with almost half (49.2%) of their members being of working age. It should also be noted that most household members in extended households are still in their physical prime for work, with a median age of 38 years. Moreover, compared to other types of households, a greater proportion of extended households (60.9%) own farm machines, which augment their working capability for agricultural activities.
Income Sources of Different Types of Households
The results and discussions in the following part are based on the data from the sample survey of 61 households.
Agricultural Income
Truncated households earn 33.3% of their total annual gross income from agriculture, which is the highest share of any household type, and extended households gain 26.5% of their total annual gross income from agriculture. Skipped generation and nuclear households gain very low shares of their total annual gross income from agricultural sources, representing only 15.1% and 12.1% respectively.
Non-agricultural Income Sources
Non-agricultural sources contribute more than two-thirds of the total annual gross income of all household types. Nuclear households gain by far the greatest share of their total annual gross income (87.9%) from non-agricultural sources, followed by skipped generation households (84.9%), extended households (73.5%), and truncated households (66.7%).
Non-agricultural income sources can be classified into five types: local non-farm employment, self-employment, remittances, pensions, and government support. Local non-farm employment includes: casual hire wage workers (e.g., construction workers who paid on a daily basis and workers doing piecework at home such as sewing pillowcases, mattresses or fishing net); (2) regular wage workers (i.e., those receiving a salary every week or month from a private sector employer); and (3) salaried government employees (i.e., those receiving a monthly salary from a government job). The types of self-employment are diverse, including running a beauty shop, clothing shop, grocery shop, an ice plant, noodle shop, or motorcycle repair shop, collecting vegetables from villagers and selling them in the market, selling daily goods, selling Isan food, renting out agricultural machines, collecting and selling recyclable goods, building and selling prefabricated pavilions, and exterminating a termite. The different types of households show major differences in the share of income they derive from various non-agricultural sources (Fig. 3).
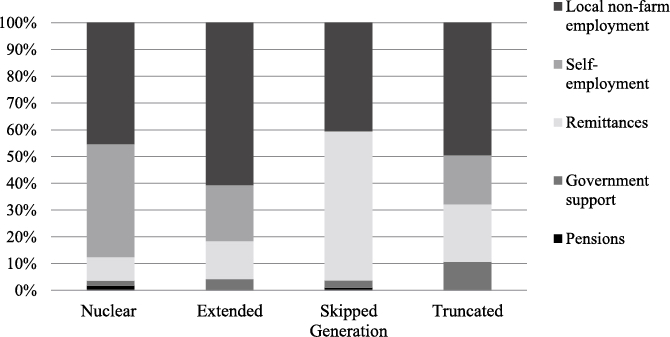
Fig. 3 Share of Income Derived from Different Non-agricultural Sources by Various Types of Households in Nong Ben Village
Local Non-farm Employment
Overall, extended households are the highest in gaining non-agricultural income from local non-farm employment (60.7%), followed by truncated households (49.6%), nuclear households (45.3%) and skipped generation households (40.6%). Skipped generation households have the highest frequency (27.6%) of earning cash from casual hired wage labor, followed by truncated households (17.6%), extended households (15.5%) and nuclear households (14%). Extended households are the highest in earning money from regular wage work (12.9%), followed by nuclear households (7%) and skipped generation households (3.4%). No truncated households report having members who are regular wage workers. The number of households having members who are salaried government employees is quite low (<6%) for all types of households. This small share of households having “salaried government employees” is probably related to the relatively low educational level of most older residents in the village and the tendency of better-educated younger people to leave the village to seek employment in the non-agricultural sector in the cities.
Self-employment
The share of non-agricultural income obtained from self-employment is the highest for nuclear households (42.3%), followed by extended households (20.9%) and truncated households (18.2%). No skipped generation households have self-employed members. Self-employment has been increasing over time in Isan villages. Earlier research in Don Daeng village in Khon Kaen Province showed that the share of households with income from self-employment was only 4.1% in 1981 but had increased to 8.3% in 2002 (Funahashi 2006). This study finds that the share of households with income from self-employment is 19.1%. The growth in self-employment may be propelled by the greater availability of cash in the villages, which allows villagers to purchase more goods and services from local enterprises. According to informal interviews with villagers, small shops and service enterprises are often opened by returned migrants who acquired capital and business experience while working in Bangkok. Many also prefer the freedom of being self-employed to working in a factory.
Remittances and Out-migrants
The skipped generation households obtain 55.6% of their total non-agricultural income from remittances and this is the highest share of any household type, followed by truncated households (21.5%), extended households (14.2%) and nuclear households (8.8%). Government statistical data show that the share of income from remittances expanded in Isan from 3.8% in 1981 to 15.9% in 2004 (Grandstaff et al. 2008, 301–306). In this study, more than half (57.3%) of the sample households receive remittances. According to group discussions, remittances are used first for improving houses, then to pay back loans, and finally for investing in agriculture.
The share of households of different types receiving remittances is related to the number of members who have left the village to work in other places. Skipped generation households, which have the highest proportion receiving remittances (88.9% of total households), all have one or more out-migrants, with an average of 2.1 out-migrants per household. These can be referred to as “supported households” (i.e., households with income mainly from outside support) that are composed of aged people who often take care of their grandchildren whose parents work away from the home (ibid.; Rigg and Salamanca 2011, 564; Rigg et al. 2012, 1477). Truncated households receiving remittances, all of which also have out-migrants, show the second-highest number of out-migrants, with an average of 1.4 out-migrants per household. The mean numbers of out-migrants in nuclear and extended households are smaller than for the former types of households, 0.9 and 1.1 out-migrants per household respectively.
Surprisingly, the nuclear households, which have both the lowest share receiving remittances (31.6% of total households) and the lowest number of out-migrants per household, receive the largest median amount of remittances (48,750 baht ≈ USD1,4051)), although this figure is skewed by the very large remittances sent back to two of these households by migrants working abroad. Skipped generation households, which have the highest proportion receiving remittances, show the second-largest median amount of remittances (46,000 baht ≈ USD1,326). Migrants from nuclear households tend to send remittances on a regular basis, whereas migrants from the other household types tend to send remittances irregularly.
Government Support and Pensions
Due to their having the highest proportion of people aged 60 or older, truncated households receive the largest share of government support (10.7%) among all household types, followed by extended households (4.2%), skipped generation households (2.8%) and nuclear households (1.8%). Only nuclear and skipped generation households have members receiving pensions, but the share is quite low (<2%) for both types.
Shares of Income from Different Sources
As the results that have presented above, the total annual gross income from non-agricultural sources exceeds the income gained from agriculture for all types of households even though distinct differences among different types of households are evident. Thus, for all household types agricultural income contributes only a relatively small share of total household income. The shift from agricultural to non-agricultural sources of income for rural households that we have observed in Nong Ben appears to be a common pattern in the whole Northeast region (Kuchiba 1990; Chai 1991; Rigg 2005; Funahashi 2006; Grandstaff et al. 2008; Rigg and Salamanca 2009; 2011; Keyes 2010; Rigg et al. 2012; 2014). Indeed, rural households in Northeast Thailand are hardly unique in this shift from dependence on agricultural to non-agricultural income sources: worldwide the proportion of the labor force in agriculture and the contribution of agriculture to gross national product have both declined at all income levels (Bernstein 1992, 5) as employment opportunities in factories, offices, and the service sector have been growing, leading many rural villagers to move into the cities while many others stay in their villages but commute to local non-farm jobs. Consequently, the importance of non-farm income has been increasing even in farming households, in the developing world in general (Murray 2001; Deichmann et al. 2009; Owusu 2009).
Income and Debt
The different types of household also display considerable differences in levels of income and indebtedness. Nuclear households have the highest mean annual gross income per capita (94,207 baht ≈ USD2,715), followed by truncated households (66,429 baht ≈ USD1,914), extended households (55,084 baht ≈ USD1,587), and skipped generation households (54,941 baht ≈ USD1,583). The nuclear households also have the highest mean annual net income per capita (38,206 baht ≈ USD1,101), followed by extended households (23,344 baht ≈ USD673) and truncated households (17,453 baht ≈ USD503), while the skipped generation households have the lowest net income per capita (5,570 baht ≈ USD161).
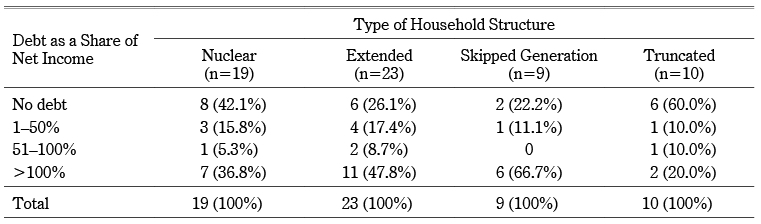
Many households of all types are in debt to a greater or lesser extent, although the extent of indebtedness varies greatly among the different types. The sample household data shows that 60% of truncated households and 42.1% of nuclear households have no debts whereas 74% and 77.8% of extended and skipped generation households are in debt. In the case of skipped generation households, two-thirds (66.7%) have debts exceeding 100% of their annual net income, followed by extended households (47.8%), nuclear households (36.8%), and truncated households (20%) (Table 3). Most nuclear and extended households that are in debt borrowed money from a bank or a company that employs household members, while the majority of skipped generation and truncated households are indebted to their friends and a village fund. All household types except the truncated households borrow money mainly for their day-to-day living expenses, but there are some distinctions among different types of households. Extended households are the highest in borrowing money to invest in agriculture, whereas nuclear households are the highest in borrowing money to pay for their children’s education. The truncated households have the lowest level of indebtedness, as most household members are elderly people who retired from active life after their children became independent. One truncated household borrowed money for their living expenses; another borrowed to buy stock for their small grocery shop; another borrowed to purchase inputs for a paddy field; and another borrowed to repay a loan on a motorbike. The majority (57.1%) of the skipped generation households incurred debt by borrowing money for their living expenses. The skipped generation households are in the worst economic situation, having the highest level of indebtedness and the lowest amount of income with which to repay their debts. This is in agreement with the study by Thuttai Keeratipongpaiboon (2012) that skipped generation households in Thailand facing the problem of financial difficulty since this household type has a serious concern for increasing the proportion of indebtedness.
Table 3 Debt as a Share of Net Income of Different Types of Households in Nong Ben Village (n=61)
Conclusion
Many important changes have been occurring in the types of rural households and their sources of income in Northeast Thailand as part of the agrarian transformation in the region. Households have declined in size while becoming more structurally diverse. Nuclear households, which were the most common structural type in the past, are increasingly being replaced by extended, skipped generation and truncated households. The latter two types, which are disproportionately composed of elderly people, are characterized by low levels of income and, in the case of skipped generation households, very high levels of indebtedness.
At the same time as they are becoming structurally more diverse, rural households have become increasingly dependent on non-agricultural sources of income. Even truncated households, which are the most reliant on agricultural income of any structural type, derive only one-third of their total income from farming. Non-agricultural income sources, which include local non-farm employment, provision of services within the village, remittances, and pensions and government support, are integral elements of the modern rural economy.
The extent to which these major shifts in rural household structures and sources of income, especially the growing importance of non-agricultural income, have transformed rural society in the Northeast has not been fully recognized by the Thai media, the educated public in general, or government policy makers. Instead, the stereotype of Isan villagers as subsistence-oriented peasants who depend on family farming as their main source of income remains strongly entrenched, and the extent to which the livelihoods of villagers have become deeply integrated with the modern Thai economic system is still largely unrecognized. Government rural development and poverty reduction policies and programs intended to improve the social and economic situation of Isan villagers need to take the changed nature of household structures and sources of income into account if they are to achieve their desired results.
Accepted: January 19, 2017
Acknowledgments
This research was supported by a grant (BRG5680008) from the Thailand Research Fund Basic Research Program to Prof. Terry Rambo. Our research also benefited from two grants from NASA’s Land Cover and Land Use Change Program: “Forest, Agricultural, and Urban Transitions in Mainland Southeast Asia: Synthesizing Knowledge and Developing Theory” (NASA Grant No. NNX14AD87G), and “Increased Accessibility, Landscape Changes, Rural Transformations, and Urbanization: Impacts of the East-West Economic Corridor from Da Nang, Vietnam, to Khon Kaen, Thailand” (NASA Grant No. NNX13AC51G). The views expressed in this paper are solely those of the authors and may not reflect any opinions of the granting agencies. The authors are grateful to the villagers for their willing participation in this research and the hospitality they showed us.
Dr. Suchint Simaraks, Prof. Funahashi Kazuo, Prof. Fukui Hayao, and Associate Prof. Dr. Chai Podhisita have provided valuable advice on this research. Chalee Gedgaew and Somkid Naprom helped in conducting group discussions in the village.
The authors are grateful to the villagers in Nong Ben for their willing participation in this research and the hospitality they showed us. We especially appreciate the help received from the village headman, Tavichai Khriyangkhrom, since this research could not have been successful without his patience in answering our questions.
References
Amare, Mulubrhan; Hohfeld, Lena; Somchai Jitsuchon; and Waibel, Hermann. 2012. Rural–Urban Migration and Employment Quality: A Case Study from Thailand. ADB Economics Working Paper Series No. 309. Manila: Asian Development Bank.
Bernstein, Henry. 1992. Introduction. In Rural Livelihoods: Crises and Response, edited by Henry Bernstein, Ben Crow, and Hazel Johnson, pp. 1–9. Oxford and New York: Oxford University Press in association with The Open University.
Chai Podhisita. 1991. The Rural Thai Family: Some Observations and Research Needs. In Report on a Thai Family and Household Survey, edited by Bhassorn Limnanonda, Chai Podhisita, and Malinee Wongsith, pp. 6–29. Bangkok: Institute of Population Studies, Chulalongkorn University.
Chawanote, Chayanee; and Barrett, B. Christopher. 2013. Non-farm Occupational and Earnings Dynamics in Rural Thailand. Cornell University Charles H. Dyson School of Applied Economics and Management, Ithaca: New York. barrett.dyson.cornell.edu/Papers/NonfarmDynamics_ChawanoteBarrett%2025%20March%202013%20Revisions.pdf., accessed on March 27, 2017.
Deichmann, Uwe; Shilpi, Forhad; and Vakis, Renos. 2009. Urban Proximity, Agricultural Potential and Rural Non-farm Employment: Evidence from Bangladesh. World Development 37 (3): 645–660.
Funahashi Kazuo 舟橋和夫. 2006. Don Den mura saisaiho: Tohoku Tai tensuiden noson ni okeru yonjunen kan no dotai kenkyu ドンデーン村再々訪―東北タイ天水田農村における40年間の動態研究 [Revisit to Don Daeng village: Forty years of dynamic research on a rainfed rice-growing village in Northeast Thailand]. Final Report of Grants-in-Aid for Scientific Research (A), Ryukoku University.
Grandstaff, Terry B.; Grandstaff, Somluckrat; Limpinuntana Viriya; and Suphanchaimat Nongluck. 2008. Rainfed Revolution in Northeast Thailand. Southeast Asian Studies 46(3): 289–376.
Hammel, E. A.; and Laslett, Peter. 1974. Comparing Household Structure over Time and between Cultures. Comparative Studies in Society and History 16(1): 73–109.
Janlekha, Kamol. 1968. Saraphi: A Survey of Socio-Economic Conditions in a Rural Community in North-East Thailand. World Land Use Survey, Occasional Papers No. 8. London: Geographical Publications Limited.
Keyes, F. Charles. 2010. From Peasant to Cosmopolitan Villagers: Refiguring the “Rural” in Northeastern Thailand. Paper for a conference on “Revisiting Agrarian Transformations in Southeast Asia,” Chiang Mai, May, pp. 1–23.
―. 1975. Kin Group in a Thai-Lao Community. In Change and Persistence in Thai Society: Essays in Honor of Lauriston Sharp, edited by G. William Skinner and A. Thomas Kirsch, pp. 274–297. Ithaca: Cornell University Press.
Kuchiba Masuo 口羽益生, ed. 1990. Don Den mura no dento kozo to sono henyoドンデーン村の伝統構造とその変容 [Tradition and change in Don Daeng village]. Tokyo: Sobunshya.
Lux, E. Thomas. 1961. The Thai-Lao Family Systems and Domestic Cycle of Northeastern Thailand. Part II. Social Science Asia: Journal of the National Research Council of Thailand 5: 1–17.
Mizuno Koichi 水野浩一. 1981. Tai noson no shakai soshiki [Social structure in a Thai village]. Tokyo: Sobunshya.
Murdock, G. P. 1949. Social Structure. New York: Macmillan.
Murray, Colin. 2001. Livelihoods Research: Some Conceptual and Methodological Issues. Background Paper 5. Chronic Poverty Research Centre, Department of Sociology. University of Manchester.
National Statistics Office of Thailand. 2010. Number of Households and Household Size by Region. popcensus.nso.go.th/home.php, accessed on March 20, 2017.
Nurge, Ethel. 1965. Life in a Leyte Village. Seattle: University of Washington Press.
Owusu, Francis. 2009. Livelihoods. In International Encyclopedia of Human Geography, 12 vols., edited by Rob Kitchin and Nigel Thrift, pp. 219–224. Amsterdam: Elsevier.
Rambo, A. Terry; and Jamieson, Neil L. 1973. Cultural Change in Rural Vietnam. SEADAG Working Paper, Asia Society, New York.
Rigg, Jonathan. 2005. Poverty and Livelihoods after Full-time Farming: A South-East Asian View. Asia Pacific Viewpoint 46(2): 173–184.
Rigg, Jonathan; and Salamanca, Albert. 2011. Connecting Lives, Living, and Location: Mobility and Spatial Signatures in Northeast Thailand, 1982–2009. Critical Asian Studies 43(4): 551–575.
―. 2009. Managing Risk and Vulnerability in Asia: A (Re)Study from Thailand, 1982–83 and 2008. Asia Pacific Viewpoint 50(3): 255–270.
Rigg, Jonathan; Promphaking Buapun; and Mare, Le Ann. 2014. Personalizing the Middle-Income Trap: An Inter-generational Migrant View from Rural Thailand. World Development 59: 184–198.
Rigg, Jonathan; Salamanca, Albert; and Parnwell, Michael. 2012. Joining the Dots of Agrarian Change in Asia: A 25 Year View from Thailand. World Development 40(7): 1469–1481.
Shirai, Yuko; Rambo, A. Terry; and Laohasiriwong Suwit. 2007. The Multifunctionality of Paddy Fields in Northeast Thailand. In Workshop proceedings on the Role of Paddy Fields in Nurturing Aquatic Ecosystems and Maintaining Agroecosystems Biodiversity, Mekong River Commission, Vientiane, August, pp. 39–42.
Smith, Harold E. 1978. Chapter II: The Thai Rural Family. In The Family in Asia, edited by Man Singh Das, Panos Demetrios Bardis, and Carle Clark Zimmerman, pp. 16–46. Delhi: Vikas Publishing House.
Sunantha Kotrchantra. 2002. An Evaluation of Village and Urban Community Fund: Case Study of Nong Ben Village, Tambon Non Thon, Muang District, Khon Kaen Province. Report for Graduation Diploma in Project Management and Evaluation, Graduate School, Khon Kaen University.
Takeuchi, Takao. 2004. An Overview on the Sustainability of a Rural Village Increasing Part-Time Farm in Northeast Thailand. Annual Bulletin of Rural Studies 40, Special Issue on The Rise of Part-Time Farming and Its Sustainability in Rural East Asia in 21st Century, pp. 155–186. Tokyo: Japanese Association for Rural Studies, Nosan Gyoson Bunka Kyokai.
Thuttai Keeratipongpaiboon. 2012. Population Ageing: Changes in Household Composition and Economic Behavior in Thailand. Dissertation for the Degree of Doctor of Philosophy in Economics in School of Oriental and African Studies, University of London, U.K.
1) The official exchange rate was US$1 = 34.7 baht on September 20, 2016.
![]()
