Contents>> Vol. 3, Supplementary Issue
Impacts of Savings Groups Programs on Household Welfare in Laos: Case Study of the Vientiane Vicinity during the Mid-2000s
Kongpasa Sengsourivong* and Mieno Fumiharu**
* ກອງປະຊາ ແສງສຸລິວົງ, EBIT Consultancy Co., Ltd, House#040, Unit03, Ban Xang Khou, Xaythany Dist., P.O. Box 4953, Vientiane Capital, Lao PDR
** 三重野文晴 , Center for Southeast Asian Studies, Kyoto University, 46 Shimoadachi-cho, Yoshida Sakyo-ku, Kyoto 606-8501, Japan
Corresponding author’s e-mail: fmieno[at]cseas.kyoto-u.ac.jp
DOI: doi.org/10.20495/seas.3.SupplementaryIssue_85
Based on original household survey on the six villages in Vientiane vicinity in 2005, the paper investigates the impact of Savings Groups (SGs) programs on household income, expenditure, and asset, applying the methodology of Coleman’s (1999) study on Thailand to address placement bias and endogeneity problem.
The results revealed that SGs programs brought certain changes; SGs boosted educational expenditures implying activation of human capital formation, increased the house asset suggesting villagers’ investment reflected by possible business activation, and brought a possible shift in income sources from traditional agriculture to livestock raising.
The paper interprets these different results from Coleman ( ibid. ) in two possible ways; First the Laotian case is to an extent, free from a bias associated with seed capital allocation, therefore is more suitable to capture the effect than Thailand, and second it is since the stage of financial accessibility in Laos is far less developed than in Thailand.
Keywords: Laos, poverty reduction, estimation bias, micro lending, savings groups
I Introduction
Since the late 1980s, the Laotian government has regarded microfinance and improved access to finance in rural areas as major tools for alleviating poverty. The government advanced microfinance as a priority program for agriculture and forestry under the National Growth and Poverty Eradication Strategy in 2004. Since 1987, the government or foreign donors have implemented broad microfinance initiatives under numerous development projects.
In reality, however, microfinance in Lao PDR remains shallow despite donors having significantly invested in microfinance programs during the 2000s. According to the Microfinance Capacity Building and Research Programme (2005), one million economically active Laotians potentially need formal or semi-formal financial services, but only one-quarter gained access to them. For the estimated 300,000 Laotians who accessed loans and savings services, accessibility to formal financial services remains limited: 21% received microcredit from formal sources, 33% from semi-formal financing sources and project initiatives, and 46% from informal sources.
Since the early 2000s, however, one source of microfinance—savings groups (SGs), also called Credit Union or Village Banks—has spread around urban locales such as Vientiane or Luang Phabang. Usually established in villages, SGs mobilize savings from member households to provide loans. SGs typically operate under a cooperative system to improve members’ lives and extract them from poverty. Most SGs around Vientiane receive technical support from the Small and Rural Development Project for Women and the Capacity Building Project for Women and Community, co-organized by the Central Lao Women’s Union, the Foundation for Integrated Agricultural Management (FIAM), and the Community Organizations Development Institute of Thailand (CODI).
This paper evaluates whether Laotian SG programs during the mid-2000s meet their primary objective of alleviating poverty. Most of the poor and lower-income Laotians join microfinance programs seeking opportunities to save and borrow at rates more reasonable than those charged by informal moneylenders. Our study expects and hypothesizes that longstanding members of SGs may improve their living in terms of asset, income, and expenses.
This paper is organized as follows. Section 2 discusses earlier studies and the observation target of our analysis. Section 3 explains our survey design, and section 4 demonstrates our estimation methodology. Section 5 examines the general picture with descriptive statistics. Section 6 examines the estimation results. Section 7 concludes.
II Overview and Object
Few empirical studies have examined data for individual persons, households, communities, or institutions to assess whether microfinance is reducing poverty in Laos. Further, studies that have investigated the poverty-reducing impact of microfinance programs in Bangladesh or Thailand suffer from selection bias and endogeneity (Pitt and Khandker 1996; 1998; Pitt et al. 1999; Coleman 1999; 2002; Khandker 2003; Khandker et al. 1998; McKernan 2002; Morduch 1998). In their pioneering study, Pitt and Khandker (1996; 1998) attempt to correct those two statistical problems in a study of Grameen Bank and two other group lending programs in Bangladesh. Their quasi-experimental household survey of 87 villages randomly sampled SG members and non-members from villages with microfinance programs, and it randomly sampled households from villages without such programs. Their studies evidenced a major problem in estimation methodology: When a dummy for credit program availability was applied as an identifying variable, endogeneity from program placement may have caused systematic variation between the two types of villages. To address that problem, their estimation considers village fixed effects to control for unobserved variation between villages. Nonetheless, their sampling of villages with SG programs may have included households ineligible for them,1) causing collinearity among village-specific dummy variables (or fixed-effect dummy variables) and program availability.
Khandker (2003) addressed the problem by expanding the dataset into panel data via a follow-up survey of the same households he surveyed in 1998–99. He controlled self-selection bias using the criteria of eligibility for SG membership at the earliest period sample. Per Coleman (1999), however, such criteria are ambiguous in practice, and this method faces serious limitations.
Coleman ( ibid. ) sought to evade selection bias without exogenous membership criteria by creating a unique data-collecting survey methodology that applies straightforward estimation techniques. His survey was conducted among SG members and non-members in 14 villages in Northeast Thailand in 1995–96. Six of those villages that received NGO support to run SGs for less than one year were identified as “control” villages. There, a self-selection process arose on whether to join SGs, while the impact of the program was not realized. The remaining eight villages where SGs had operated for more than two years were defined as “treatment” villages.2) A comparison between members of “old” SGs in treatment villages and “new” members in control villages could be undertaken. To estimate SGs’ impact, Coleman used variations in the length of time programs that were available in the treatment villages. Based on empirical evidence, it concludes that most studies endorsing positive impact of microfinance found in Northeast Thailand may be merely seeming identifications occurred from selection bias or endogenous program replacement.
We follow Coleman’s ( ibid. ) methodology for two reasons. First, it is the most suitable for considering the two bias problems, given the data available for the vicinity surrounding Vientiane.3) Second, SG programs we observed closely resembled those in Coleman ( ibid. ). SG programs in our study were initiated by the same NGO as in Coleman ( ibid. ). An NGO, FIAM in Thailand organized SGs in rural Northeast Thailand during the 1990s. Together with another NGO, CODI, the practice was exported to villages in the Vientiane vicinity in the 2000s.
Practices of SGs in Northeast Thailand and Laos slightly differ. According to Ohno and Patcharin (2009) and Ohno’s first paper in this special issue, FIAM usually introduced its programs to existing SGs instead of establishing new institutions, and it gave them seed money to strengthen their savings functions. Because seed money was allocated based on the number of SGs’ members regardless of mobilized savings amounts, the impact of seed money may vary among SGs villages. Accordingly, the distinction between new and old SGs/villages in Northeast Thailand is vague. In addition, while the program con tains function as pure credit providers similar to Grameen Bank type microfinance, its effect is possibly intermingled with that from SGs’ own saving resources. In contrast, NGOs generally started Laotian SGs without seed money, and SGs gradually accumulated lendable funds from members’ savings. Considering the differences in the two cases, Coleman’s (1999) methodology is better suited to Laos. We expect to capture clearer evidence using his methodology even though it did not present compelling evidence concerning Northeast Thailand.
We surveyed 251 households in six villages in a semi-urban area of the Naxaithong District 16 kilometers from Vientiane. The six villages contained old SGs that had operated for more than one year or new SGs established more recently. In all six, villagers self-selected to become SG members; the survey sampled members and non-members. Members were classified into a “treatment” group who had obtained credit or received dividends from their SG and a “control” group who had received no such benefits. The effects upon SG members in the treatment group can be compared with SG members in the control group. We used the period of membership as basic information in the impact estimation. Finally, using non-member households in all six villages as samples, we implemented fixed-effects village estimations to control for endogeneity from program placement. This survey design facilitates straightforward assessment of how SG programs influence household welfare.
III Interview Survey
During the period of our survey in 2005–06, 357 SGs operated throughout Lao PDR, primarily in and around the capital, assisted and monitored by one of seven agencies.4) A significant number of SGs operated in Vientiane. We conducted interviews concerning the microfinance project launched by the Women and Community’s Empowering Project in three semi-urban districts of the capital. From these three districts we selected villages in the Naxaithong District for observation.
A survey was conducted in September 2005 for 251 households in six villages that had their own SGs. Three villages had recently established new SGs, two had SGs that had been organized three months earlier and one village’s SG had operated only for one month. Three villages had “old” SGs that had operated from slightly more than one year to almost three years. These surveyed villages were selected from the list provided by project administrators. Three “new” SGs were selected based on the distance condition in a way that the three old SGs were located not far, within 15 kilometers, from the three new SGs.
Table 1 summarizes the sampled SGs/villages. The percentage of member households varies between 40–89% and is seemingly unrelated to whether the SGs were old or new. We assured that our survey randomly sampled one-quarter of all households (24.4%). Old and new SGs have members who have been benefitted by obtaining credit or receiving dividends and those who have not received financial benefits from SGs.
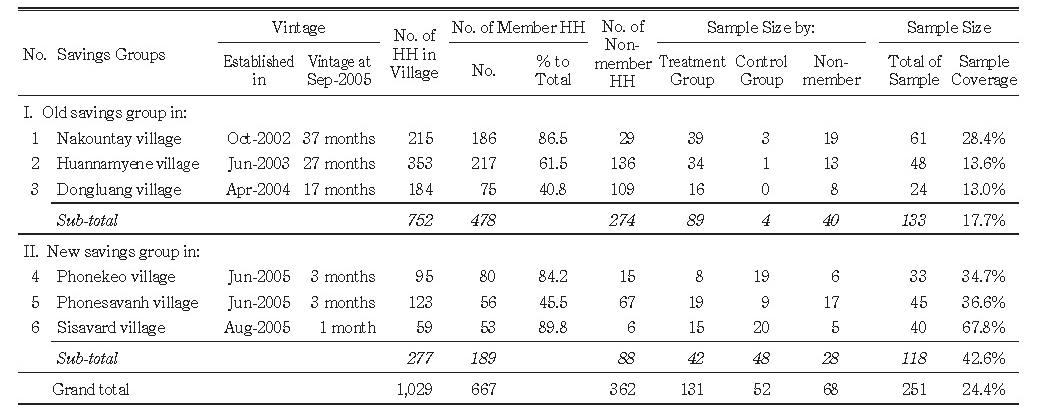
Following Coleman (1999), we defined the first set as the treatment group and second as the control group for empirical analysis.
Our three-part survey questionnaires followed Hulme and Mosley (1996)5) with slight modifications to fit purposes of our study. The first part pertained to member and non-member households in the six villages. It contained questions about household characteristics, including assets, income, expenditures, deposits, and borrowing. Some questions about assets, income, and expenditures inquired into households’ financial situations during two periods: on the survey date in September 2005 and five years earlier. For each member and non-member household, we interviewed an adult or head of household at home concerning household finances.6)
The second part of the questionnaire sought village-specific information such as schools or prices of goods. We interviewed the head of the village and members of each village SG’s committee.
The third part of the questionnaire gathered general information about SGs. It included questions regarding the number of members, sources of funds, SGs’ deposit balances, deposit and credit methods, and resolving bad debts.
Third-year students in economics and business management at the National University of Laos conducted the household surveys. They were trained and supervised by one of the authors in September 2005. One of the authors conducted the village surveys and in-depth interviews with the SG group committees. In addition, a follow-up survey in March 2006 with the chief of the Lao Women’s Union for the Naxaithong District collected supplementary data about villages’ and SGs’ characteristics. Secondary data from summary reports, progress reports, and SG manuals were obtained from the project, municipal arms of the Lao Women’s Union, and SG group committees.
IV Estimation Model
This section discusses the model specifications and methodology with which we tested the hypothesis that long-term SG members enjoy a higher quality of life as measured by asset, income, and expense.
IV-1 Model Specification
As discussed in Pitt and Khandker (1996) and Coleman (1999), the presiding difficulties in estimating the impact of microfinance programs arise from selection bias and endogenous placement of the program. Consider the following estimation specification:
Cij = Xij βc + Vj γc + εijc (1)
Yij = Xij βy + Vj γy + Cij δ + εijy , (2)
where
Cij : the level of SG program participation,
Xij : a vector of household characteristics (e.g., age and education of household head),
Vj : a vector of village characteristics (e.g., prices and community infrastructure).
Traditional estimation of Equation (2) usually yields biased parameter estimates because εijy and εijc are correlated. As Coleman ( ibid. ) illustrated, the correlation between εijy and εijc arises through selection bias because households with attributes Xij and Vj were motivated to join SGs, whereas others were not. For example, if many entrepreneurial households join SGs, the unmeasured factor “entrepreneurship” affects their decision to join and measures their income, expenditures, and assets. In addition, εijy and εijc may be correlated across villages if SG program placement is not random. As Coleman ( ibid. ) highlighted, εijy and εijc can be correlated if program placement is affected by villages’ socio-economic factors such as conditions more suited to entrepreneurship, civic organ ization, dynamic leadership, or poverty-provoking situations (e.g., living in flood plains or drought-prone areas).
Better ways to cope with the statistical problem may include using a panel sample set or proper instrument variables. However, both methods are infeasible, and even a panel dataset does not resolve bias completely, thus Coleman ( ibid. ) proposed a primitive but interesting alternative, which we basically adopted. To collect an appropriate sample of households that are long-time SG members, households that recently joined SGs, and households that have not joined SGs, we surveyed two types of villages: those where SGs have operated for a long period (the old villages) and those where SGs were recently established (the new villages). In the old villages most member households have enjoyed the benefit in forms of credit or dividend, whereas in the new villages many new members have remained unbenefitted yet. The survey identified three types of households associated with SGs.
1) Treatment Group: SG member households who have benefitted as SG members in both old and new villages.
2) Control Group: SG member households who have recently participated SGs, and have not yet benefitted mainly in the new villages.
3) Non-Members: SG non-members in sampled villages.7)
In the estimation process, combining a dummy variable for SG membership (M), isolates non-members, and a dummy for members who benefitted from SG membership eliminates the self-selection and endogenous placement biases, as follows.
Yij = Xij α + Vj β + Mij γ + Tij δ + υij , (3)
where
Mij : a membership dummy equal to 1 if household ij self-selected SG membership and 0 otherwise.
Tij : a dummy variable equal to 1 if a self-selecting household has already benefitted as an SG member and 0 otherwise.
δ : measures the average impact of SGs on Yij .
In practice, our sample gives a better proxy for Tij . The empirical model in Equation (3) can be improved by recognizing that some treatment members have benefitted longer than others from SG membership. Our survey design captured SGs that operated in the six villages from one month to three years. In these six villages, some households belonged to relatively old SGs, and their span of membership varied with the age of the SGs. Taking into account that the cumulative effect that a member can utilize credit and receive dividend from their savings, grows over the life of the SG, one would expect to see greater impact in villages with older SGs. The empirical model can be rewritten as
Yij = Xij α + Vj β + Mij γ + MAMTij δ + μij ,
where the treatment dummy Tij is replaced by MAMTij , the number of months that the SG has operated in the village. In other words, MAMTij can be construed as the number of months participants have benefitted from SG membership. Now, δ measures the impact per month of program availability. If the order of program placement, however, is not random with respect to unobservable village characteristics, then correlation between MAMTij and εijy can be eliminated with village fixed effects. According to Coleman ( ibid. ), this specification in Equation (4) is considerably easier to estimate (if Yij is uncensored, ordinary least squares [OLS] is appropriate). If the order of program placement is random with respect to unobservable village characteristics, we can obtain efficient and unbiased estimates with Vj as a vector of specific village characteristics.
To carefully examine estimated impacts and possible biases, we compared the results of four types of estimations, following Coleman ( ibid. ).
1) The “Super-naïve” model: estimation without considering control variables for self-selection and non-random placement.
2) The “Naïve” model: estimation with a traditional variable controlling for self-selection. Here, the variable “land value owned by the household five years before this survey” is expected to absorb the participation incentive.
Our survey design enables us to employ the SG membership dummy to control self-selection bias, since we prepare measures for the length of time that respondents belonged to SGs (months of membership) besides the dummy. Because we must consider the possibility of non-random placement, we prepared two types of estimations.
3) A “Non-fixed-effects” model: if program placement is random, the model with non-fixed-effects for village attribute generates efficient and consistent estimators.
4) A “Fixed efficient” model: if program placement is not random, estimations by the non-fixed-effects model can be inconsistent. Using a fixed-effects model associated with village attributes, we gain consistent (though possibly inefficient) estimators.
IV-2 Estimation Methodology
Assuming that dependent variables (household outcomes) are uncensored, we applied OLS for estimating Equation (4). Moreover, we applied the White test for heteroskedasticity, which leads to unbiased estimators of OLS. Then we used generalized least squares (GLS) estimation to correct heteroskedasticity (weighted least squares estimations per Wooldridge [2003, 268–276]).
V Descriptive Observation
V-1 Sample Villages
Table 2 summarizes basic information for sampled villages. The initial survey did not necessarily collect details about SGs/villages, as its objective was to collect household-level data about expenditures, income, and assets. As an alternative, we used data from Mieno and Chansathith (2014), who surveyed about 80 SGs around Vientiane, including all 6 of our surveyed villages, in September 2008. Note that Table 2 shows data for 2008, three years after our 2005 survey period. Table 2 suggests no notable distinction in primary source of livelihoods between old and new villages. Dong Luang appears to be an exception among all six villages because non-agricultural activities are its primary livelihood; the remaining five villages are essentially rice-producing communities with some secondary income sources.
The bottom half of Table 2 indicates the purposes for SG loans, and the nonagricultural nature of Dong Luang indicates no clear differences about the comparison among Consumption, Durables, and Production; for example, purposes for borrowing in Dong Luang parallel those in Nakountay, a typical rice-producing village. Data under the column Ground Average show little difference from that of 80 Sample Average.8) Remarkable differences in loan purposes appear between old and new SGs. The column Old SGs Average indicates that 84.2% of loans were for production purposes during the surveyed period. Among the new SGs, 51.7% of loans were for production purposes and 37.0% for consumption. Among components of consumption lending by new SGs, average percentages for education (7.2%) and medical services (7.7%) are strikingly higher than for old SGs (0.2% and 0.4%, respectively). Among new SGs, 40.6% of loans were for agricultural production versus 26.9% among old SGs, but old SGs issued a greater percentage of loans for business purposes (41.3% versus 10.7% for new SGs).
Data in Table 2 suggest that SGs lend to support members’ consumption during their early stages and shift to production lending as they age. Agricultural lending dominates lending for production during SGs’ early stages and shifts to business purposes. Table 2 shows the picture three years after our 2005 survey, when the three old SGs had operated one-and-a-half to three years. Thus, we presume that SGs which were old in 2005 were in a stage similar to new SGs during the 2008 period shown in Table 2. That is, relatively young SGs mainly granted credit for such consumption purposes as education or medical care.
Table 2 Livelihood and Savings Groups Operation of Six Sample Villages
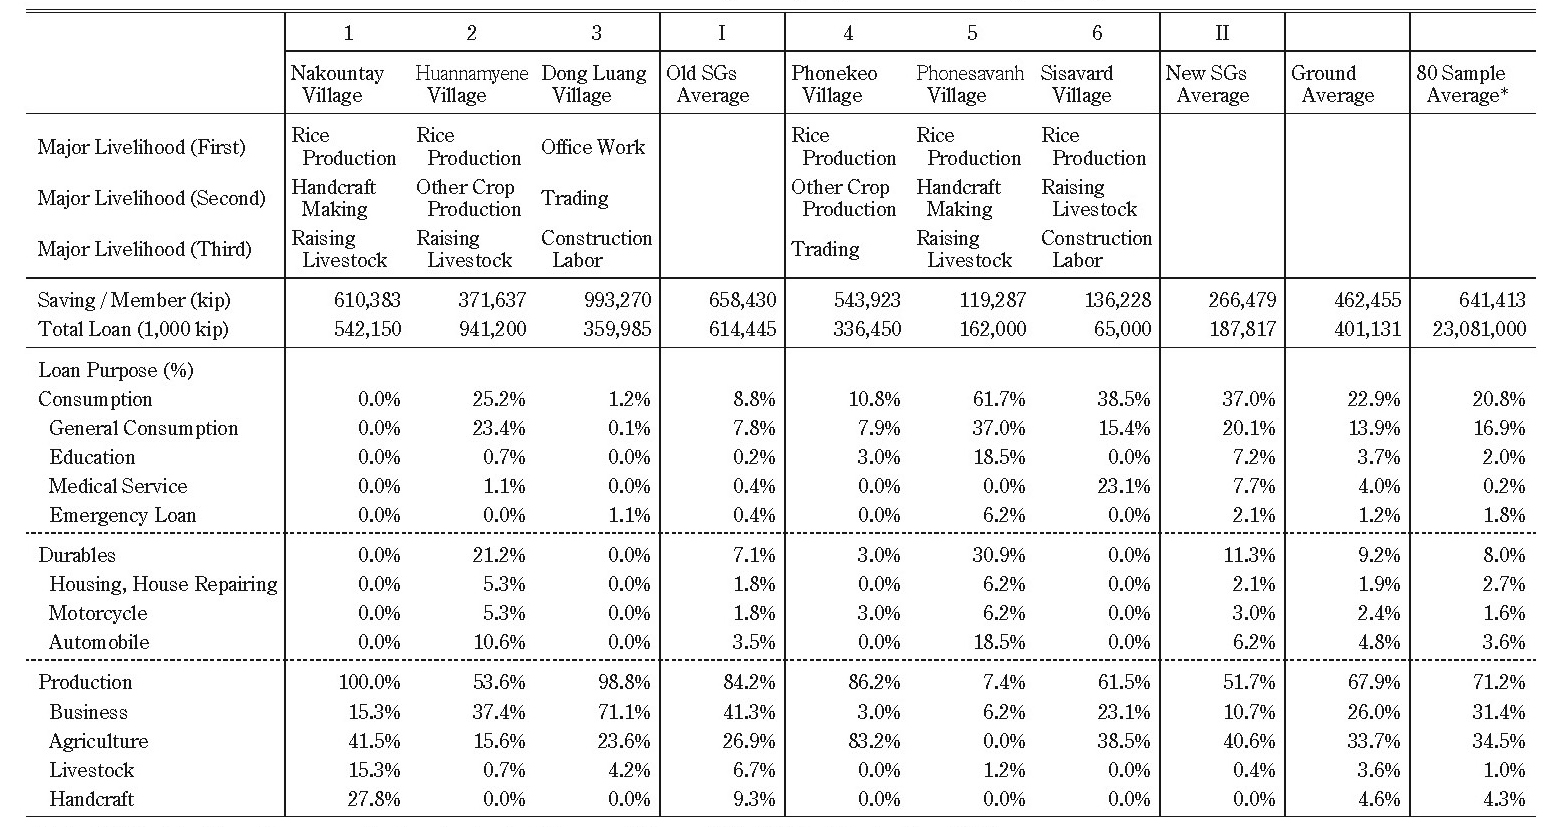
Note: * Calculated from the survey for the chapter by Mieno and Chansathith (2014) at September, 2008
V-2 Independent Variables and Characteristics of the Sample Households
Table 3 summarizes variables representing household and village characteristics. The sample contains 251 households: 131 (52%) in the treatment group, 52 (21%) in the control group, and 68 (27%) non-members. Variables in Table 3 are generally utilized as independent variables in the estimation. They are classified into four categories.
Section I.1 shows the length of SG member scaled by month. The mean is 15 months for the treatment group and 1 month for the control group and by definition 0 for non-members.
Section I.2 shows household characteristics. Data in I2-3 and I2-4 indicate that, household heads are males in more than 90% of cases, whereas respondents to the interview (i.e., SG members) are mostly females. The mean education year is 4.90 years for the whole sample, 4.69 years for the treatment group, 5.27 years for the control group, and 5.01 years for non-members. Table 3 suggests that internal networks influence participation in SGs as follows. For the whole sample, villagers have an average of 2.42 relatives in the village; the average number of relatives is 2.27 for villagers in the treatment group, 2.21 in the control group, and slightly higher at 2.87 for non-members. The average number of civil servants per household is 0.27 for the whole sample, 0.28 for the treatment group, 0.37 for the control group, and 0.16 among non-members.
Table 3 Descriptive Statistics for Independent Variable
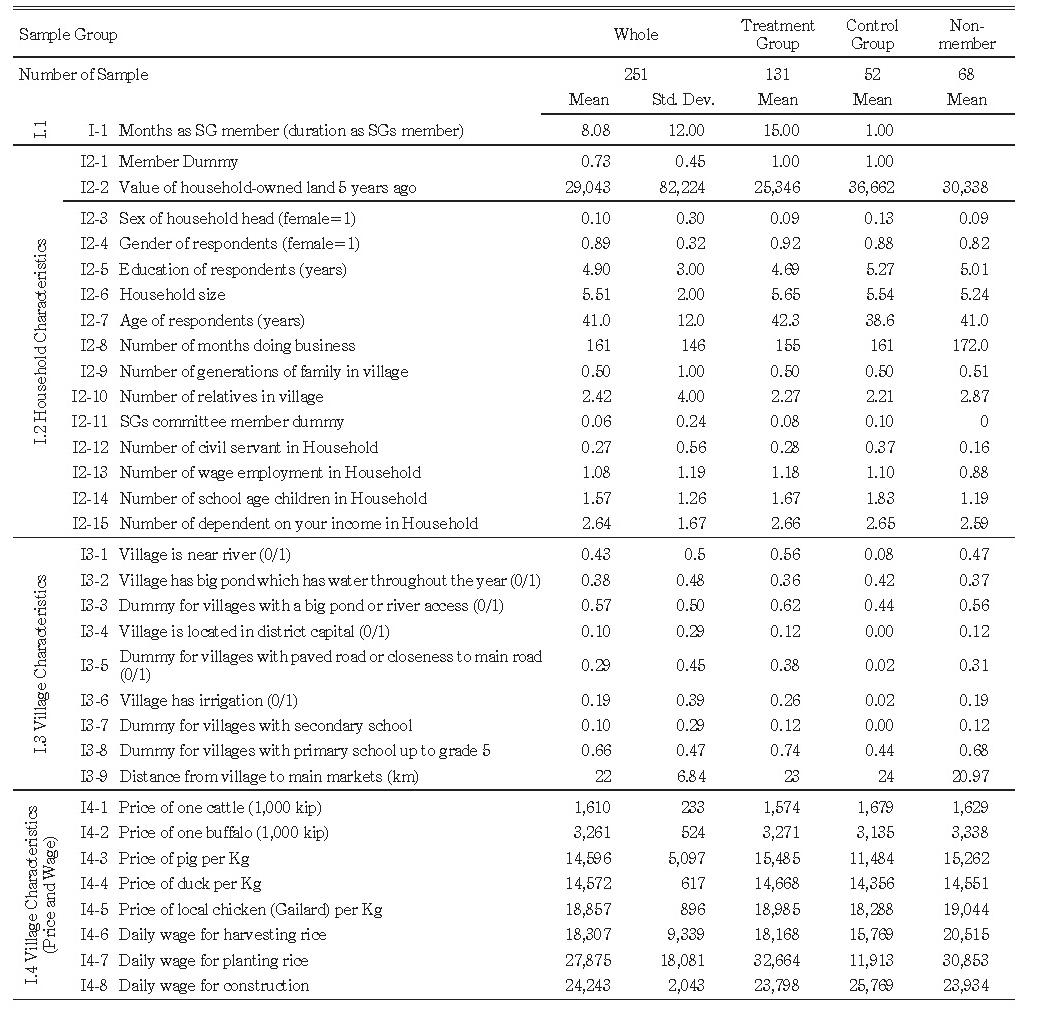
Sections I.3 and I.4 report village characteristics and price factors, respectively. Data show that 40–50% of villages enjoy access to water. Only 19% of villages have irrigation systems. Two-thirds (66%) have a primary school, but only 10% have a secondary school.
V-3 Observation on the Dependent Variables
Table 4 presents three general categories of indices for household welfare as dependent variables: (A) Expenditures, (B) Assets, and (C) Income. Household expenditures consist of (A1) Food and (A2) Non-food Expenditures. The latter contains seven subcategories, including Transportation, Education, and Medical expenditures. Assets include (B1) House, (B2) Land, and (B3) Others. Others contain five subsets, including Agricultural assets, Livestock, and Savings. Household income includes (C1) Self-employment and (C2) Employment Income, subdivided into seven and five categories, respectively. In total, we prepared 34 dependent variables.
Table 4 compares the mean values of dependent variables classified by treatment, control, and non-member groups. The difference between mean values of the control group and non-members shows the possibility of participation bias. That means the values for the treatment group exceed those for the control group in all three categories—Expenditures, Assets, and Income—suggesting that SGs’ lending programs sponsor positive welfare effects.
Among Expenditures, the notable relationships are for Non-food Expenditures and in subcomponents such as Education, Clothing, and Medical. Among Assets, the noteworthy relationships are House and Land. Among Income, on the other hand, SGs’positive effect is suggested by wide ranges in Self-employment and Employment income.
A comparison between control groups and non-members suggests household membership in SGs. Mean values for control groups are larger for Household Total Expenditures and most of its subcomponents, suggesting that households with higher expenditures have a larger tendency to be SG members. The gap between Food and Non-food Expenditures is more remarkable for non-members, suggesting the necessity for non-food expenditures is an incentive to join SGs.
Table 4 Descriptive Statistics of Dependent Variables
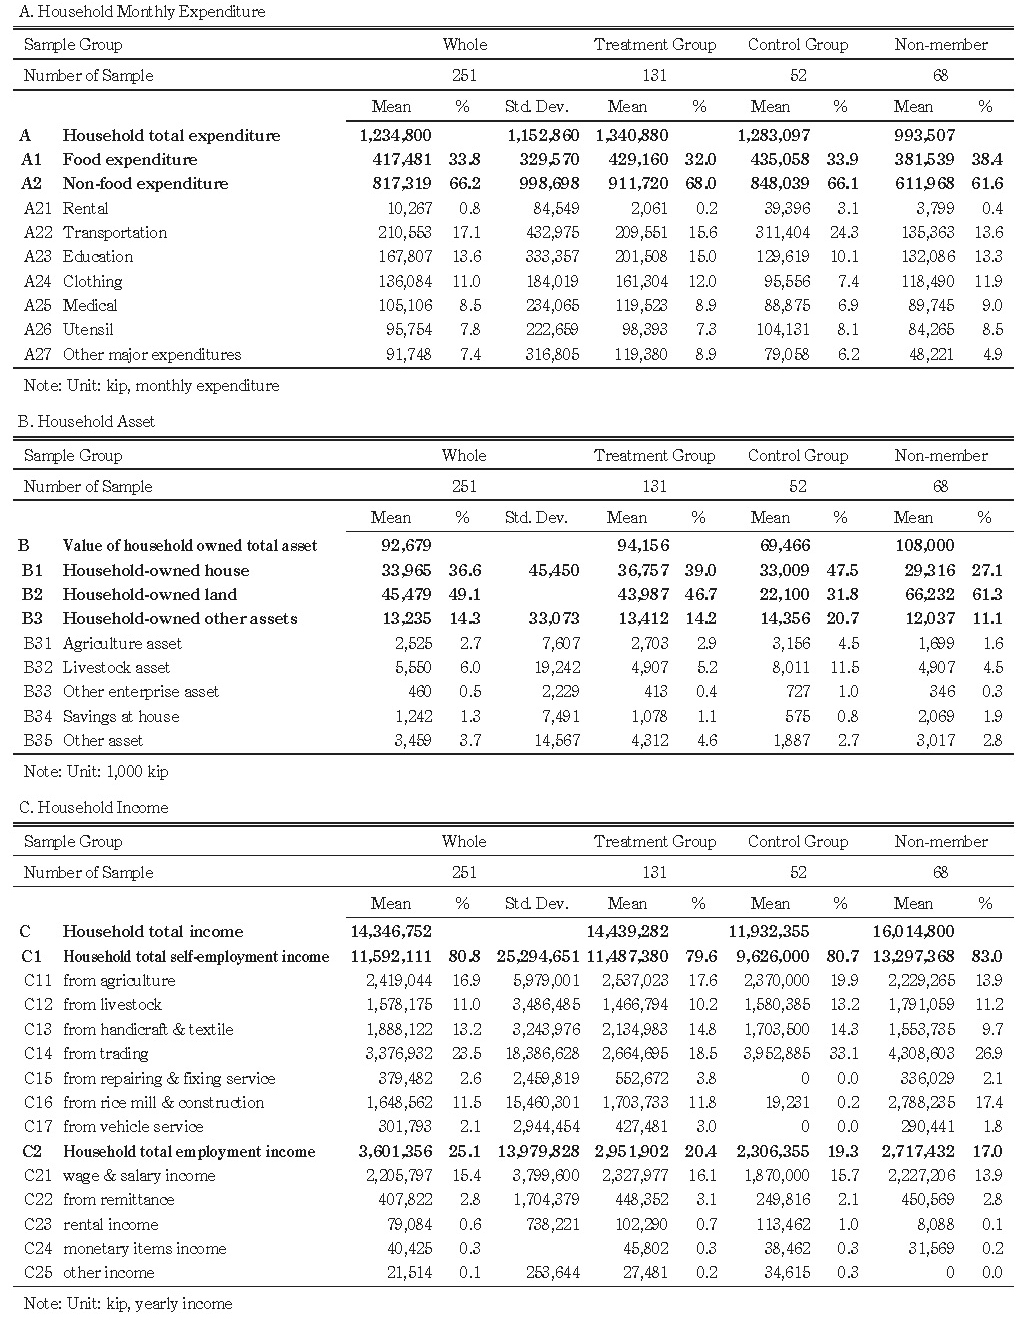
Regarding Assets, however, wealthier households appear inactive to join SGs. In particular, the gap in the subcomponent of Land seems large (66,232 kip for non-members and 22,100 kip for the control group), suggesting that those richer in land asset are notably inactive to join SG activities. In fact, this tendency is overwritten by the independent variable Value of Household-owned Land 5 Years Ago (Table 3, I2-2). Similarly, Household Total Income and all its subcomponents suggest that wealthier households generally appear inactive to join SGs.
VI Empirical Results
Equation (4) estimated the effect of SG membership duration, the SG membership dummy, ex ante household assets,9) and other independent variables on all 34 dependent variables associated with household expenditures, assets, and income (Table 4).
In a comparable setting with data for similar SGs in Northeast Thailand, Coleman (1999) insists that the effect of SG membership is scarcely evident in any welfare indices after considering selection and placement biases. Although the influence of the SG participation on welfare could not be found in most dependent variable cases, we found five dependent variables influenced by it covering assets, income, and expenditures. Examining assets, we found a positive and significant result for (1) Household-owned House. With regard to income, we found correlations among subcomponents of Self-employment Income from (2) Livestock (positive) and (3) Agriculture (negative). Among Expenditures, we found correlations in variables for (4) Rental and (5) Education.
We now analyze estimation results for these five cases (Table 5). For all five, the effect of SG membership duration is significant—positive for four dependent variables and negative for agricultural income. Data for (1) House Asset suggests that SG credit has an improvement effect directly or indirectly. Positive results for income from (2) Livestock and negative results for (3) Agricultural income may suggest that SG members borrow to raise livestock and that lending for that purpose promotes a shift from traditional farming. The result for (4) Rental expenditures suggests that SG lending enables members to activate the livelihood activities in agriculture or non-agriculture. The result for (5) Education suggests that SG lending enables members to pursue education.
In Table 5, estimation results for Value of Household-owned Land 5 Years Ago, the variable for absorbing selection bias between the Super Naïve model and others, are significant only for agricultural income, but the effect of SG membership duration remains positive after controlling for it. Some household characteristics are significant as control variables, but others are not. Variables representing village characteristics and wage/price variables are seldom significant.
Table 5 Summery of the Estimation Result
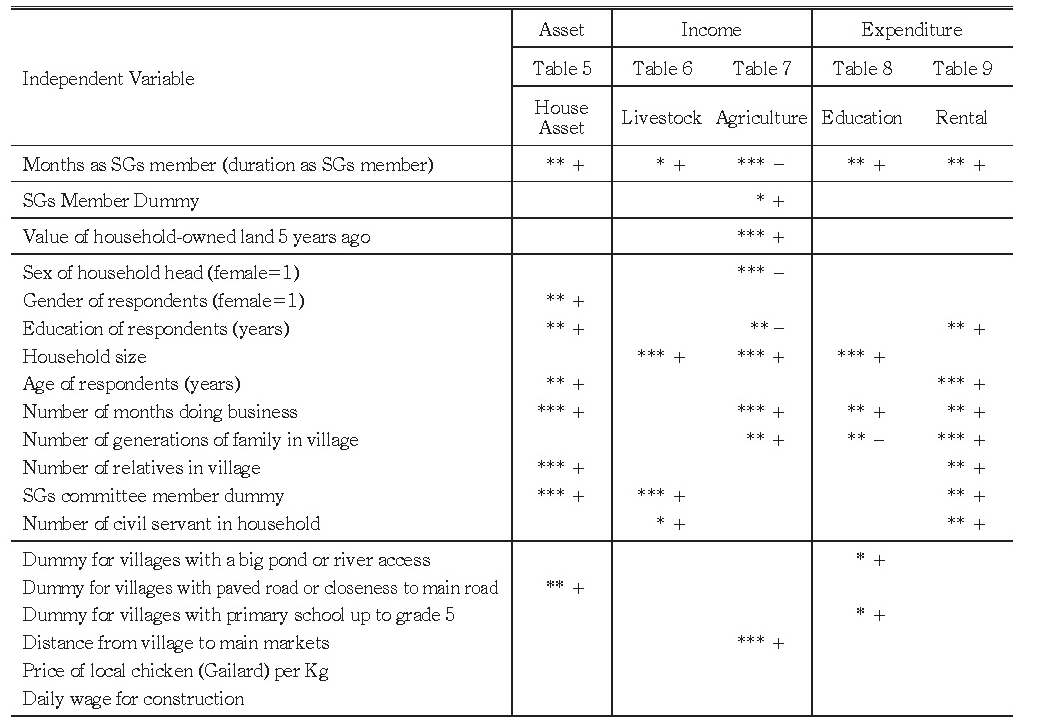
Note: Based on the non-fixed effects model. The superscripts ***, ** and * denote that coefficient is significant at 1%, 5% and 10% criteria.
VI-1 Impact on Assets: Household House Asset
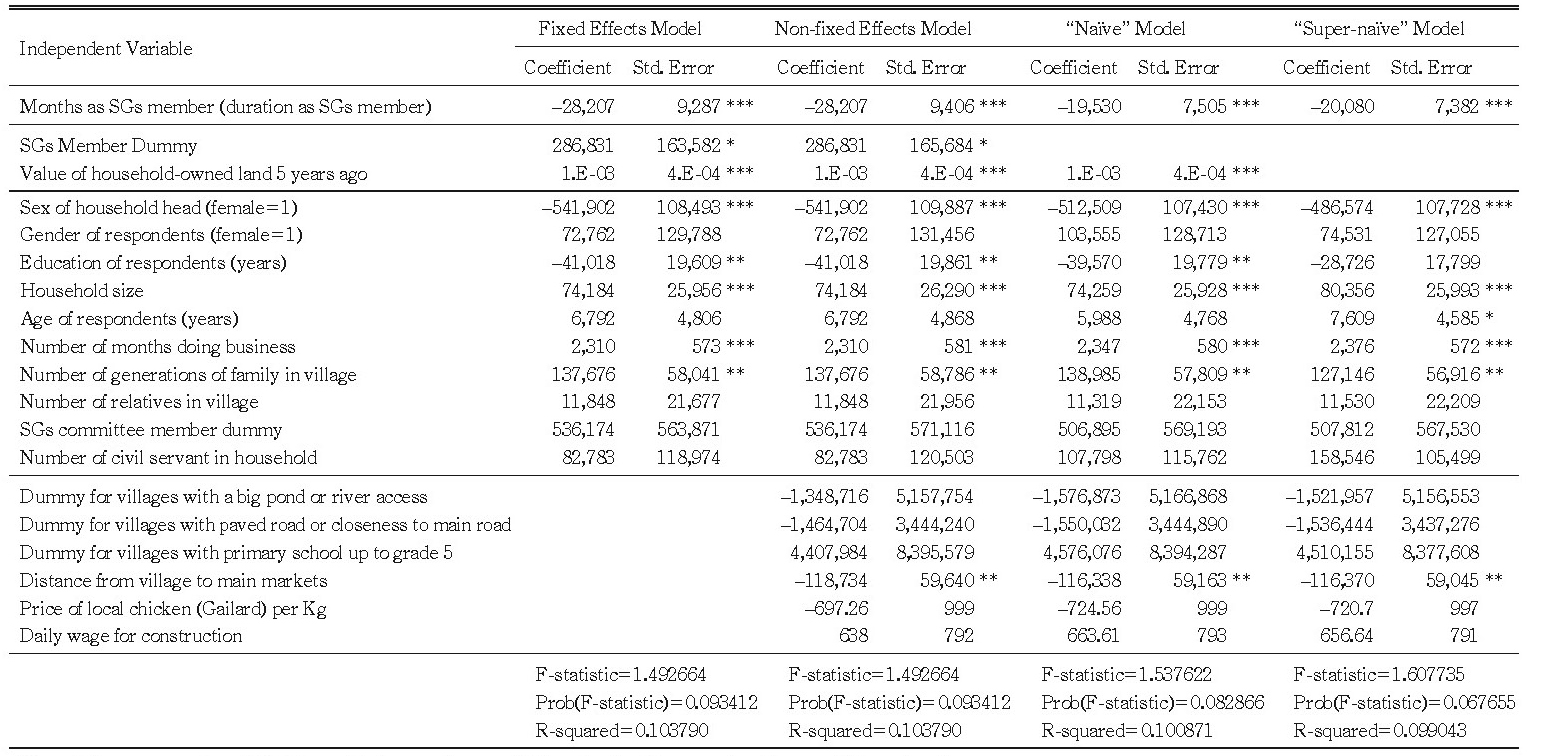
Among the category Household Assets in Table 4, estimation results confirm that Household-owned House is a primary component (36.6%) of total household assets. In Table 6, F-statistics for all four model specifications are strongly significant. In all four specification regressions, the coefficient of Months as SG Member is positive and significant. A large proportion of coefficients in both the Naïve and Super-naïve models show significant impact. In the fixed-effect and non-fixed-effect models, which control possible placement bias, the coefficient of Months as SG Member is lower, but significant at 5% and 10%, respectively. These results sharply contrast with those in Coleman (1999; 2002), which shows insignificant effects of SG membership on house value.
The coefficient for Value of Household-owned Land 5 Years Ago (Table 6) is positive, but statistically insignificant in three specifications, implying that selection bias in a form that the initial wealth affects the house asset at observation period is trivial and can be ignored.10)
The coefficient of SG Member Dummy with respect to house asset value is insignificant, consistent with Coleman (1999; 2002), indicating that unobservable differences between members and non-members (such as entrepreneurship and preferences) make no difference. Therefore, in the fixed- and non-fixed effects models, Table 6 indicates no correlation between Member Dummy and house asset value, also suggesting no selection bias caused by unobservables.
Comparing the fixed- and non-fixed-effects models in Table 6, the effect of Months as SG Member is inconsequential; the statistical significance is slightly weak in the non-fixed-effects model, and coefficients are almost identical. For the explanatory variables to control village attributes in the non-fixed-effects, Naïve, and Super-naïve models, and the factor for paved roads is negative and statistically significant. The result roughly shows that the fixed-effects model sufficiently absorbs differences among villages and any effect of endogenous program placement is unclear.
Estimation results show significant influence of several household characteristics on house asset. Although the Sex of Household Head (female) dummy in Table 3 is insignificant, at least at the 10% level, the dummy for Gender of Respondents (Table 3) shows a positive and significant relation to house value in all four estimation models. Education of Respondents is highly significant in all four estimation models at the 5% level, which indicates that human and physical capital are complements in production (Coleman 1999, 120). Age of Respondents, Number of Months Doing Business, Number of Relatives in Village, and SG Committee Member Dummy are significant and positive in most specifications.
VI-2 Impact on Income: Income from Livestock and Agriculture
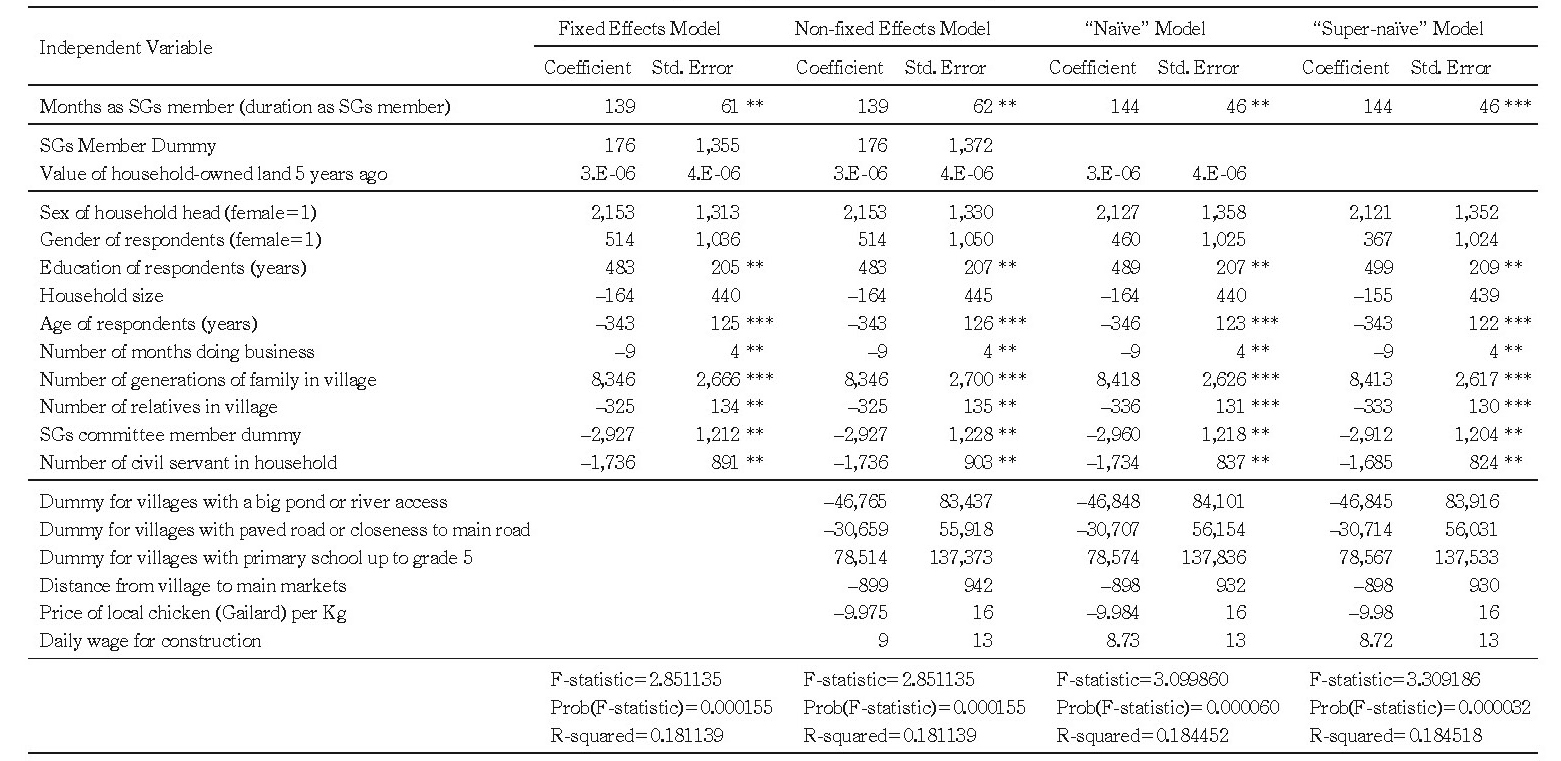
Unlike the examination of assets, we could hardly found the evidence of the overall impact for improvement by the SG membership in the income side. Results for regressions involving self-employment and employment income are insignificant. However, evidence of a certain change in composition of household livelihoods was suggested in the estimations: participation in SGs decreases the composition of agricultural income and slightly increases that of livestock income.
In Table 7, the effect of SG membership on income from livestock is positive in all four specifications: coefficients for Months as SG Member are positive and significant in the fixed-effects and non-fixed-effects models (at 10% significance), implying that SG participation increases livestock production. On the other hand, in all four specification models, agriculture income (Table 8) correlates significantly and negatively with months of SG membership. Results are significant at 1% in all models, suggesting the negative correlation is stable.
Table 6 Impact of Savings Group on Household House Value—GLS
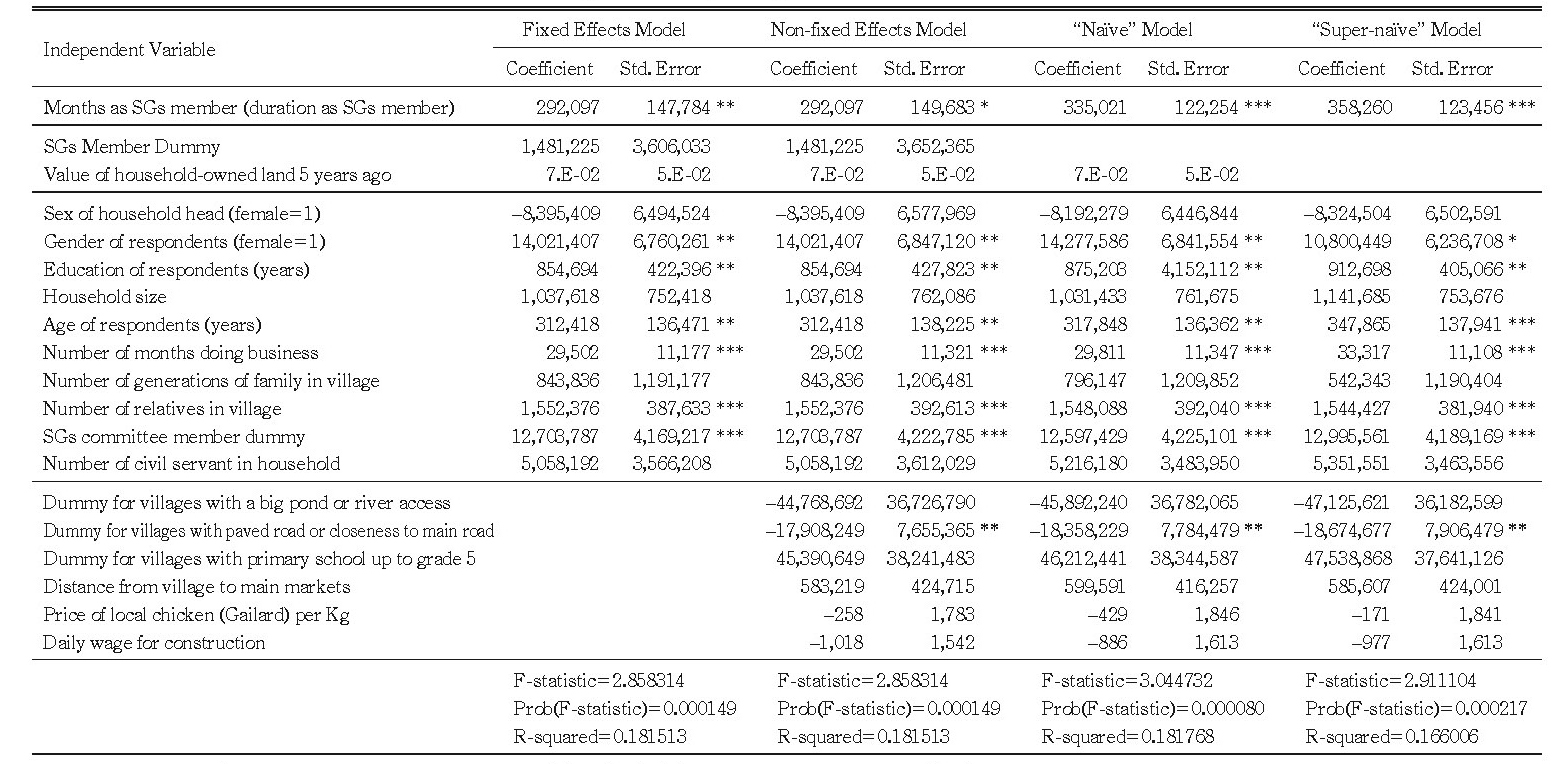
Note: The superscripts ***, **, and * denote that coefficient is significant at 1%, 5%, and 10% criteria.
The member dummy is significant for agricultural income, implying that unobservable differences between members and non-members matter in estimation results, whereas they are insignificant for livestock income. Although estimations for agricultural income find correlations with many explanatory variables for household characteristics such as household size (positive) or education (negative), only a few explanatory variables influence livestock income. Village characteristics seldom influence the condition.
As summarized in Table 4, agricultural income averages 16.9% of total income in the whole sample, and livestock income averages 11.0%. Both are major income sources for village households. Our finding shows that membership in SGs is associated with a progression in village livelihoods from agriculture to livestock production. These results contrasted with results for Northeast Thailand. Coleman (1999) discovered nothing about the impact of SG membership on income and income structure. Our finding, however, is unclear. The positive correlation of SG membership with livestock income is significant only at 10%, and such substitution relation does not necessarily appear consistent with the descriptive observation in Table 4 (columns C11 and C12).
VI-3 Impact on Expenditure: Education and Rental Expenditure
We found no clear overall impact of SG membership on total expenditures (Table 4). But the clear and positive correlation between SG membership and educational expenditures is a noteworthy finding. Education expenditures average 13.6% of total expenditures, the second-largest component of Non-food Expenditure. SG members borrow for education—that is for human capital formation.
Table 9 shows the impact of SG membership on education expenditures with the four specifications. Months as SG Member relates positively at 5% significance in all specifications except in the Super-naïve model. Per results in the fixed-effects model, belonging to an SG for one more month could raise educational expenditures by 5,670 kip, for example.
As for the comparison among four specifications in Table 9, the SG Membership Dummy and Value of Household-owned Land 5 Years Ago are insignificant, suggesting negligible bias from unobservables. Among variables for village characteristics, Villages with a Primary School up to Grade 5 correlates positively and significantly with educational expenditures.
Table 7 Impact of Savings Group on Self-employment Income from Livestock—GLS

Note: The superscripts ***, **, and * denote that coefficient is significant at 1%, 5%, and 10% criteria.
Table 8 Impact of Savings Group on Household Self-employment Income from Agriculture—GLS
Note: The superscripts ***, **, and * denote that coefficient is significant at 1%, 5%, and 10% criteria.
As a supplemental finding, we note a clear but substantially weak correlation between SG membership and rental expenditures. Table 10 shows the regression results on rental expenditures for all specifications. The coefficient is significant at 1% for the Super-naïve model and 5% for the remaining specifications. This result could be evidence that SG membership facilitates self-employment in raising livestock and fish or in non-agricultural activities. At 0.8% of total expenditures, the effect of Rental expenditures is, however, limited. For rental expenditures, the explanatory variable of education level is positive and significant at the 5% level in all four estimation models. This result may imply that better-educated Laotians launch or expand new business by acquiring physical capital through SG credit.
VI-4 Interpretation
Our finding suggests that SG programs around Vientiane generally encourage diversification on household livelihoods. First, SGs’ strong positive contribution to educational expenditures is apparent and confirmed in the fixed- and non-fixed-effects models, the strictest forms of estimation. The apparent difference in mean values for the amount and share of educational expenditures between the treatment group and others (control group and non-members) in Table 4 underwrites the estimation results. As Table 2 shows, education loans are one of the largest components of lending among young SGs, suggesting that increase of educational expenditures is realized through loosened cash constraint by SG loan as a direct effect. Supporting human capital formation beyond short-term income generation is the most vital service SGs provide during their early stages.
Second, we find that SG microfinance is associated with an increase in house values. There are two ways to interpret this finding. As a direct way, it can be realized by investment for a particular purpose such as starting or expanding a business; as an indirect way it can be a result of income generation. Table 2 indicates that loans for durables, including house repair, are a somewhat higher percentage of loans among young SGs, suggesting the existence of the direct effect; investment in housing is activated by improved access to credit.
Third, results for increased livestock income and decreased agricultural income imply that households gravitate toward livestock raising beyond their traditional agricultural pursuits. However, the result is not necessarily consistent with the descriptive observation. In Table 4, income from livestock among the treatment group is somehow less than among the control group, and non-members (although it is consistent in income from agriculture). Also, Table 2 suggests that lending for agricultural purposes is relatively robust among young SGs. Any effect SGs have in changing household income sources from traditional agriculture to more diversified livelihoods remains vague.
Table 9 Impact of Savings Group on Household Educational Expenditure—GLS
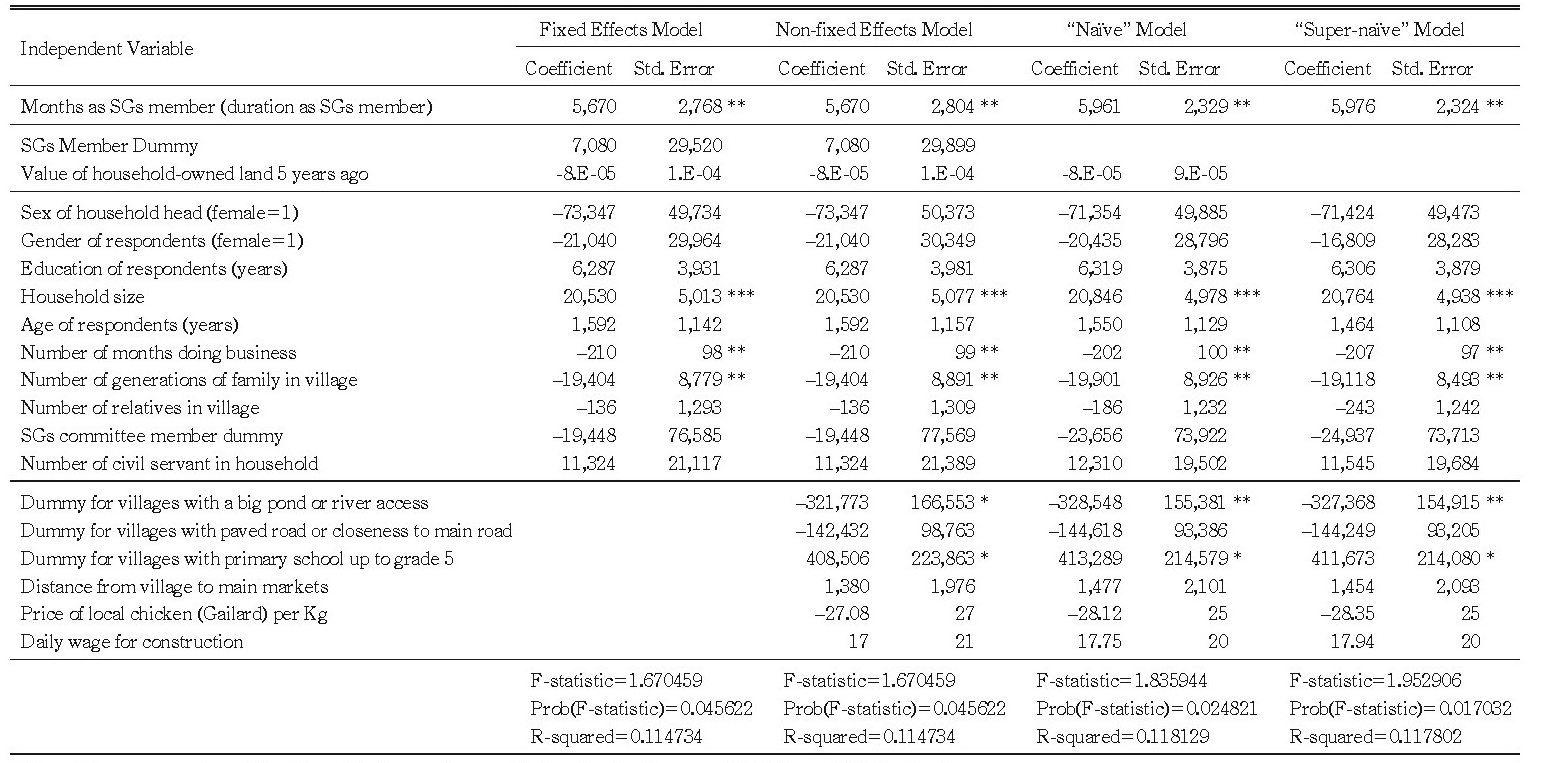
Note: The superscripts ***, **, and * denote that coefficient is significant at 1%, 5%, and 10% criteria.
Table 10 Impact of Savings Group on Household Rental Expenditure—GLS
Note: The superscripts ***, **, and * denote that coefficient is significant at 1%, 5%, and 10% criteria.
Finally, the impact on rental expenditures gives side evidence that SGs encourage entrepreneurship. However, the share of rental income among total income is low (0.6% in Table 4), so the effect is trivial and caution is warranted in interpreting this result.
Although this study’s primary contribution is fact-finding relevant to Laos, several factors distinguish Laos from Thailand in Coleman (1999). From a methodological perspective, characteristics of SGs differ, as Ohno and Patcharin (2009) and Ohno’s first paper in this special issue indicate. Since NGO programs in Northeast Thailand started by supporting existing SGs, information about members of new groups (membership dummy=1 and duration=0 months) may not provide pure signals of the control group. In addition, since programs distributed seed money regardless of SGs’ mobilized saving size, seed money may be significant for some SGs and trivial for others, resulting that the impact for the treatment group contained such serious disturbance factors.
In this sense, the methodology may better fit the Laotian case. Since NGOs began SGs in Laos the new SGs/villages are truly new. Seed money, a serious disturbing factor in analyzing Thailand’s case, is rarely distributed among programs in the Vientiane area. In a socio-economic context, the stage of the village economy may offer an explanation. Thailand’s rural economy was well developed and diversified even in the mid-1990s, and a degree of formal credit had reached even rural areas. However, only about three-quarters of Lao PDR’s one million working population can access formal or semi-formal financial services. Moreover, only 6% of credit-eligible borrowers could benefit from reasonable interest rates, and 4% of them deposit money in formal financial institutions (Microfinance Capacity Building and Research Programme 2005).11) Given this situation, SGs were a vital and nearly the sole (except for informal finance) providers of financial services during mid-2000s, even in the semi-urban area surrounding Vientiane.
VII Conclusion
Coleman (1999) raised the possibility of selection bias and endogenous placement of program in pioneering studies such as Pitt and Khandker (1996; 1998) and Khandker (2003). He tackled the problem with a unique sample design in examining SGs in Northeast Thailand. He found that many apparent correlations were caused by biases between the program and welfare factors, and warned that earlier studies may overestimate the impact of microfinance.
Following Coleman’s (1999) survey design and estimation methodology, we found that SG microfinance bolsters household income, expenditures, and assets in Laos. We estimated the influence of SGs on 34 welfare indices, about half the number (72) in the benchmark study. Although Coleman ( ibid. ) universally denied any causal impact in all of his observations, our estimations indicate an impact in five index cases on assets, income, and expenditures.
We found that SGs boost educational expenditures as a major function. We also found an increase in assets (house asset), suggesting villagers’ investment (purchase of durables and house repair) reflected by possible business activation or agricultural diversification. Although a convincing interpretation is difficult, our estimations suggest that SG microfinance prompts a shift in income sources from traditional agriculture to livestock raising, and an increase in rental income.
Our findings are basically consistent to the argument on the function of SGs in Vientiane areas discussed in other papers of this issue, and strongly support the existence of the benefit of the SG practice in Laos. Our findings also endorse the Laotian government’s current policies regarding SGs. Future scholarship needs to examine whether our findings can be generalized to situations in Laos beyond Vientiane’s socio-economic context.
Accepted: December 22, 2014
References
Barnes, Carolyn. 1996. Assets and the Impact of Microenterprise Finance Programs. Washington, D.C.: Management System International.
Chanhsana Sichanthongthip. 2004. Loan Repayment and Impact on Income in Lao Microfinance: Saithani Case. Master thesis, Sophia University, Tokyo.
Chansathith Chanleunsinh. 2004. Village Savings Groups in Lao PDR: Factors Affecting Their Growth: Case Study of FIAM/CODI Savings Group Projects in Vientiane Capital/Municipality. National Economic Research Institute, Vientiane, Laos, December 10, unpublished.
Coleman, Brett E. 2002. Microfinance in Northeast Thailand: Who Benefits and How Much? Economics and Research Department Working Paper No. 9. Asian Development Bank. April.
—. 1999. The Impact of Group Lending in Northeast Thailand. Journal of Development Eco nomics 60: 105–141.
Khandker, Shahidur R. 2003. Micro-finance and Poverty: Evidence Using Panel Data from Bangladesh. Policy Research Working Paper 2945. Washington, D.C.: World Bank.
Khandker, Shahidur; Samad, Hussain; and Khan, Zahed. 1998. Income and Employment Effects of Microfinance-credit Programmes: Village-level Evidence from Bangladesh. The Journal of Development Studies 35(2): 96–124.
Kunkel, C. R.; and Seibel, H. D. 1997. Microfinance in Laos. Bangkok: Asia Pacific Rural and Agricultural Credit Association.
McKernan, Signe-Mary. 2002. The Impact of Microcredit Programs on Self-employment Profits: Do Noncredit Program Aspects Matter? The Review of Economics and Statistics 84(1): 93–115.
Microfinance Capacity Building and Research Programme. 2005. Rural & Microfinance Statistics in Lao PDR 2004. Vientiane: National Economic Research Institute; and Concern Worldwide Lao PDR.
Mieno, Fumiharu; and Chansathith Chaleunsinh. 2014. Function of Savings and Credit Unions in Laos: From a Village-SCU Survey in Vientiane Vicinity. Center for Economic Institutions, PRIMCED Discussion Paper Series No. 52. Tokyo: Institute of Economic Research, Hitotsubashi University.
Morduch, Jonathan. 1998. Does Microfinance Really Help the Poor? New Evidence from Flagship Programs in Bangladesh. First complete draft. Retrieved June 3, 2006, from http://www.wws. princeton.edu/~rpds/downloads/morduch_microfinance_poor.pdf.
Mosley, Paul. 2001. Microfinance and Poverty in Bolivia. The Journal of Development Studies 37(4): 101–132.
Ohno Akihiko 大野昭彦; and Patcharin Lapanun. 2009. Tohoku Tai ni okeru Shinyo Kumiai no Tenkai 東北タイにおける信用組合の展開[Rural credit unions in Northeast Thailand]. Kyoto Working
Papers on Area Studies No. 15.
Pitt, Mark M.; and Khandker, Shahidur R. 1998. The Impact of Group-Based Credit Programs on Poor Households in Bangladesh: Does the Gender of Participants Matter? Journal of Political Economy 106(5): 958–996.
—. 1996. Household and Intrahousehold Impact of the Grameen Bank and Similar Targeted Credit Programs in Bangladesh. World Bank Discussion Papers 320. Washington, D.C.: The World Bank.
Pitt, Mark M.; Khandker, Shahidur R.; Mckernan, Signe-Mary; and Latif, M. Abdul. 1999. Credit Programs for the Poor and Reproductive Behavior in Low-income Countries: Are the Reported Causal Relationships the Result of Heterogeneity Bias? Demography 36(1): 1–21.
Wooldridge, Jeffrey M. 2003. Introductory Econometrics: A Modern Approach. 2nd ed. Boston: South-Western.
1) Many programs excluded households that owned more than 0.5 acres of land.
2) Among the eight villages, one is an exception because the SG began operating immediately after the first survey.
3) The location was selected because most of Laos’s 357 SGs are in and around Vientiane (Microfinance Capacity Building and Research Project, 2003, cited in Chansathith [2004, 7]).
4) The District Lao Women’s Union, District Lao Youth’s Union, District Planning Office, District Social Welfare Office, District Finance Office, District Agriculture and Forestry Office, and branches of the Agricultural Promotion Bank (Chansathith 2004).
5) Chanhsana (2004) conducted a similar study of Laotian microfinance in Saithani. It was reproduced in Mosley’s (2001) study of microfinance and poverty in Bolivia.
6) Most interviewees were females (wives) because, per Laotian custom, wives generally oversee household income and expenses. As Sheck-Sandbergen and Choulamany-Khampoui noted about Laotian females, “Women are generally good at financial management and accounting because of their social and economic experience in managing the household finances and the local economy: they are the sellers, buyers, traders, middle-women and entrepreneurs” (in Kunkel and Seibel [1997, 116]).
7) The identification of the treatment and the control group in this paper differs slightly from Coleman’s (1999). Coleman ( ibid. ) distinguishes them based on the village type (old or new) households belong to; all the households in the old villages are defined as the treatment groups, whereas ones in the new are regarded as the control groups. Our study, however, identifies the treatment and the control household based on the direct questionnaire inquiring if they have benefitted from participating in SGs both in the old and new villages.
8) It is the sample average of SGs surveyed in 2008 and the same as Table 5 in Mieno and Chansathith (2014).
9) This value stands for the value of house with land (not empty land or land for rice fields and crops). Barnes (1996, 4) cited houses as one of the physical assets representing household wealth.
10) This result also contrasts with those in Coleman (1999), who finds the coefficient of “female-owned land value 5 years ago” to be positive and statistically significant with regard to women’s wealth.
11) Agricultural Promotion Bank, the largest policy-based bank.
![]()