![]()
Contents>> Vol. 10, No. 3
Livelihood and Happiness in a Resource (Natural and Cultural)-Rich Rural Municipality in the Philippines
Rosalina Palanca-Tan* and Sheila Bayog**
*Department of Economics, School of Social Sciences, Ateneo de Manila University, Loyola Heights, Quezon City, Metro Manila 1107, Philippines
Corresponding author’s e-mail: rtan[at]ateneo.edu
**Research Center, Notre Dame of Marbel University, Alunan Avenue, Koronadal City, South Cotabato, Philippines
DOI: 10.20495/seas.10.3_413
This paper looks at the economic and welfare conditions of residents in Lake Sebu, a largely rural but natural and cultural resource-rich municipality in Southern Mindanao in the Philippines. Two notions of welfare are used in the study: economic welfare, measured in terms of household income and vulnerability to hunger; and social welfare, measured in terms of self-reported happiness. The study uses primary data collected through a household survey and analyzed with statistical and econometric procedures (tests of difference between sub-populations; and ordinary least squares, binary probit, and ordered logistic regressions). The results suggest mixed implications of abundant natural and cultural resources on the income, livelihood, and happiness of people in Lake Sebu. Nonetheless, insofar as the availability of natural and cultural resources provides more opportunities for income-generating activities, and hence makes possible multiple-income households, abundant resources in Lake Sebu may be considered a blessing and welfare enhancing. Further, the study finds no significant positive relationship between income and happiness and no significant influence of social capital, measured in terms of membership in formal organizations, on welfare (both economic welfare and happiness).
Keywords: natural resources, non-built cultural heritage, economic welfare, social welfare, self-reported happiness
Introduction
The positive welfare effects of resource endowments may initially seem clear-cut. Abundant resources can provide multiple income opportunities or livelihood sources for inhabitants of the area, and hence higher welfare. This is a basic assumption in production theory in Economics, where output is specified as an increasing function of all types of resources that can be utilized as production inputs—natural, capital, human, and even cultural resources. An OECD (2011) paper asserts that sectors related to natural resource use provide jobs and are often the basis of livelihoods in poorer communities, thus contributing toward poverty reduction.
In the early 2000s, however, the concept of the “resource curse,” in which resource wealth does not lead to well-being, gained momentum (Karak 2019). This phenomenon is most prominent in oil-rich African countries that are heavily dependent on multinational oil companies for technology, financial capital, management, and sales networks. For example, in Nigeria, a major petroleum-producing country that derives more than 90 percent of its external revenues from crude oil, locals experience “poverty in the midst of plenty” due to the exploration, extraction, and exploitation of its crude oil by foreign companies with the blessings of the government (Orogun 2010). In a more subtle way, this is also the case for some developing Asian countries such as the Philippines, where poverty remains widespread despite the country’s rich forest, land, and water resources as many of these resources are exploited by non-resident capitalists or multinationals for profit (see, for instance, Fujisaka et al. 1986; Cruz and Francisco 1993; Broad 1995; and World Bank 2017).
Literature relating natural resources to welfare in the Philippines includes papers on the dependence of the Philippine economy on natural resources, on the quantitative valuation of resource benefits, and on the resource curse.
Ian Coxhead and Sisira Jayasuriya (2001) have discussed the abundant natural resource endowments of the Philippines and their contribution to the economy—fertile lands making agriculture the largest single sector and employer in the economy, with more than half the population depending either directly or indirectly on income generated in agricultural production; and marine (17,460 km of coastline, 2 million km2 of oceanic waters, and 266,000 km2 of coastal waters) and freshwater ecosystems (384 major river systems and 54 lakes covering an area of 569,600 ha) generating fish supply and serving as major tourist and recreation sites. Both marine and freshwater resources in the Philippines are utilized for aquaculture, which generates fisheries income, foreign exchange, and food supply (Yap 1999; Rosario 2008; Palanca-Tan 2016). Specifically, seaweed farming (MAP-ABCD 2016; Pedrosa 2017) and small-scale freshwater fishponds (ADB 2005) and fish cages and pens (Palanca-Tan 2016) are shown to have provided low-income communities with primary and secondary means of livelihood that helped improve their economic conditions.
Quite recently, survey-based valuation techniques have been used to attach values to different forms of benefits derived from natural resources and ecosystems in the Philippines. Using the survey-based contingent valuation method (CVM), R. Palanca-Tan et al. (2017) estimated the total value of benefits from a well-protected Cagayan de Oro River Basin providing water supply, recreation, biodiversity, flood control, and power supply to downstream households in Cagayan de Oro City to be over 100 million pesos every year. Together with benefits accruing to other sectors, namely, industrial sectors’ water use and income for the fisheries and tourism sectors, the total economic value generated from the Cagayan de Oro River Basin was estimated to be about twice the household benefits (Palanca-Tan et al. 2018). CVM was also employed by Raul Bradecina (2014) in calculating the total economic value of beachscapes in Camarines Sur, while the travel cost method, another survey-based valuation technique, was utilized by Wilma Tejero (2014) to estimate the recreational use value of Apo Island.
The resource curse literature on the Philippines revolves around resource mismanagement and resource exploitation by the privileged few that constrain economic growth and exacerbate poverty and income inequality. Robin Broad (1995) described the case of the Philippines as a Third World, historically rainforest-rich country that followed a pattern of natural-resource exploitation that did not contribute to broader public welfare and sustainable development. The Philippines’ vast forest cover of about 70% of its total land area in 1900 was exploited and depleted to about 50% by 1950, to less than 25% by the end of the 1980s (Kummer 1992), and to less than 19% by the late 1990s (Coxhead and Jayasuriya 2001). The highly concentrated control of Philippine forests only enriched a few at the expense of just and sustainable development, creating millions of poor people in the uplands (Broad 1995). The World Bank (2017) argued that despite Mindanao’s fertile land, large deposits of minerals (particularly gold and copper), extensive forests, and vast marine resources, its economy had remained weak and failed to realize its potential for growth and development as profits from farming, forestry, and mining were siphoned out and not reinvested in Mindanao. The initial expansion in Mindanao’s economy resulted in very little multiplier effects and job creation, and hence growth was not sustained, and poverty persisted.
On the other hand, literature on cultural heritage and welfare in the Philippines is scarce. There are studies illustrating how cultural resources and heritage provide leisure, recreation, and educational facilities (Balco 2012), generate tourism activities that stimulate commerce and create new jobs (Henderson 2012), and increase income-earning opportunities and investments (Labadi 2020), but there are only a few specifically on the Philippines. Geoffrey Cruz (2017) argued that cultural heritage preservation could push the value of real estate properties in the country and more than offset the cost of preservation. Eva Marie Medina (2009) presented the case of Vigan, Ilocos Sur, as an example of how cultural heritage tourism enabled the municipality to rise from being a second-class municipality to a first-class municipality. Most recently, Palanca-Tan (2020) combined cultural heritage with natural resources in her estimate of the total benefits derived by a neighboring urban city from a rural municipality in the southern Philippines using CVM.
This paper looks at the economic and welfare conditions of residents in Lake Sebu, a largely rural but natural and cultural resource-rich municipality in the southern Philippines. The municipality of Lake Sebu in the province of South Cotabato in Mindanao is endowed with abundant natural resources (lakes, waterfalls, and caves) that offer captivating sights and exciting adventures (zip-lining, spelunking, mountain trekking, lake cruising) for residents and visitors. The municipality has the rich cultural heritage of the T’boli indigenous tribe—handicrafts (the most prominent of which is T’nalak weaving), music and dances, festivals, and beliefs and traditions. Because of its many captivating natural and cultural resources, Lake Sebu is fast becoming the prime ecotourism destination in the southern Philippines for Filipinos as well as foreigners. Moreover, its expansive freshwater bodies are used for lucrative fish farming operations that produce good-tasting tilapia, attracting visitors for dining and special celebrations and providing fish supply to neighboring cities and municipalities; and about a third of its land area is used for rice, corn and other crops, fruit and vegetable farms (a couple of which are organic), and mostly native-breed livestock and poultry raising (LSMPDO 2016). The paper focuses on the natural and cultural resource-dependent tourism, aquaculture, and agriculture (farming and livestock raising) livelihood sources in all barangays in the municipality except for Ned, which is somewhat isolated and distant from the livelihood activities mentioned.
The happiness framework, which combines economic and psychological perspectives in looking at the value of a resource, is used in this study instead of the more common economic valuation techniques. Thus, the analysis in this paper is not confined to income or economic welfare but extends to the broader concept of overall well-being, measured in terms of self-reported happiness. Using primary data collected through a household survey and analyzed with statistical (tests of hypothesis on the difference between and among sub-populations) and econometric (ordinary least squares, binary probit, and ordered logistic regressions) procedures, the study aims to:
(1) present indicators of and characterize economic and social welfare of resident households in the natural and cultural resource-rich municipality of Lake Sebu;
(2) determine whether income increases happiness; and
(3) determine the impact of social capital on income and happiness.
To date, studies of happiness in the Philippine context are largely confined to the disciplines of Psychology and Sociology (recent studies include Tolentino and Dullas 2015; Peterson 2016; Reyes 2016; Datu and Lizada 2018; Diego et al. 2018; and Lumontod 2019), while an economic perspective is still scant. Further, to the authors’ knowledge, this is the first “happiness” perspective to benefits valuation of resources in the Philippines. This paper thus adds another dimension to resource valuation research, which in recent years has focused on assigning monetary values to resource benefits employing survey-based, stated preference techniques such as contingent valuation and choice modeling (examples of such resource valuation studies in the Philippines include Subade [2007] and Palanca-Tan et al. [2018]).
Methodology
Study Site
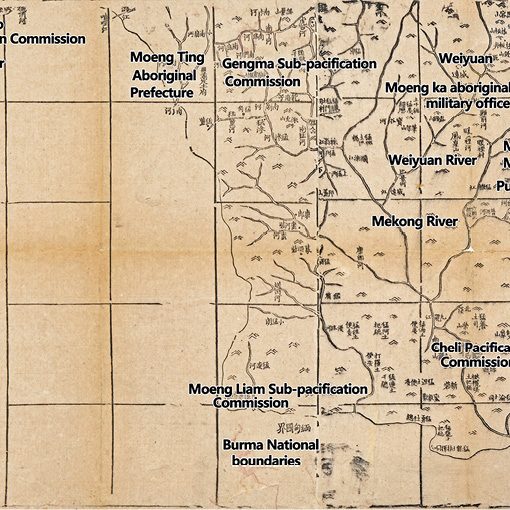
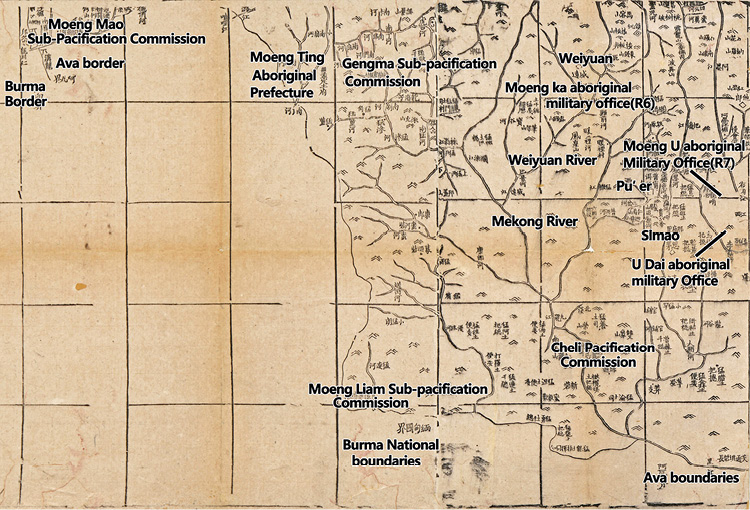
Lake Sebu, a municipality created in 1982, is one of 11 municipalities in the province of South Cotabato in Southern Mindanao. It is bounded in the northeast and southeast by the municipalities of Surallah and T’boli, respectively; in the northwest by the province of Sultan Kudarat; and in the southwest by the province of Sarangani. Lake Sebu is approximately 40 km from Koronadal, the capital and only city of South Cotabato and the regional center of Region XII (SOCCSKSARGEN).
Lake Sebu has a total land area of 89,138 ha, about 24% of South Cotabato’s total land area. It has a predominantly rugged terrain with the mountain ranges of Daguma and Talihik and Mt. Talili (with an elevation of 1,410 m) along its eastern portion, Mt. Busa (with an elevation of 2,064 m) in its southeastern portion, and Pitot Kalabao Peak (with an elevation of 1,600 m) along its central portion. There are several lakes in the municipality. The most notable and biggest among these is Lake Sebu, with an approximate surface area of 354 ha. The other lakes are Lake Lahit, Lake Seloton, and seven other small lakes. The municipality has 40 major rivers and is endowed with 103 springs located strategically throughout its boundaries. Moreover, deep wells, shallow wells, and free-flowing wells are common along its steep slopes and rolling valleys. The climate of Lake Sebu belongs to the fourth climatic type under the Coronas Classification, where rainfall is evenly distributed throughout the year. With a temperature ranging from 21° to 30° Celsius and supported by the hydrologic cycle of the lakes, it is relatively cool throughout the day (LSMPDO 2015; 2016).
Lake Sebu is home to the indigenous T’boli people, who constitute the majority 55% of its population. Hiligaynon-Ilonggo migrants account for about a fourth, or 25%, of the population; while the Cebuanos and another indigenous tribe, Ubo-Manobo, each account for about 5%.
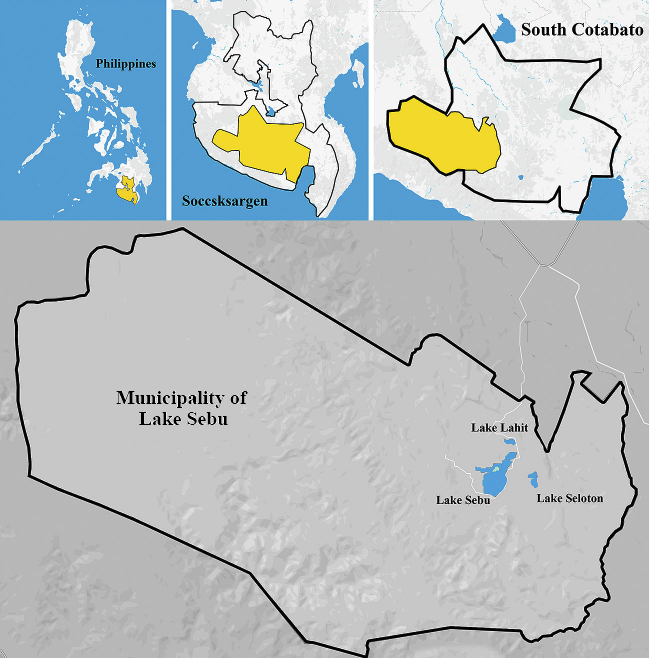
Fig. 1 Study Site: Municipality of Lake Sebu
Data Collection
This study used primary data collected through a household survey. The instrument used was largely a livelihood questionnaire finalized after a series of key informant interviews (KII), focus group discussions (FGD), and pre-tests with local government officials, sector leaders, and representative households. The 15-page questionnaire consisted of three parts. Part 1 included a brief introduction on the purpose of the survey as well as basic demographic questions about the respondent and household members.
Part 2 made up the bulk of the questionnaire (11 out of a total of 15 pages) as it asked detailed sector-specific questions on income sources of all household members. The respondent was asked which among the following six categories of income sources the household depended on: (1) fishing, (2) tourism, (3) farming, (4) livestock and poultry, (5) government/public service, and (6) others. Fishing was further categorized into fish farm owner/operator, fish nursery owner/operator, fish farm worker, open fishing and fish trading; and tourism was categorized into resort/hotel, tourist attraction, souvenir, restaurant/food service, transport services/rental, and other tourism-related sectors.
Total household income was obtained from the large, detailed data sets generated from the survey. After identifying one income source, a series of questions that would allow calculation of net income or revenues from each income source were asked: for open fishing – daily fish catch (volume and value), fishing days per week, costs incurred; for fish farming and nursery operations – farming cycles, harvest frequency and volume and value, cost items (fingerlings, feed, farm construction and maintenance, etc.); for fish trading – scale and frequency of trading (wholesale and retail), revenues and cost of fish sales; for fish farm work – work days, wage rate, and other benefits or forms of compensation (e.g., food and housing provisions and government-mandated social security benefits); for tourism-related businesses such as resorts, restaurants, souvenir production and selling, tourist attractions, and transport services – assets, average monthly net revenues of the business; for resort employees and workers, full-time or part-time – monetary compensation (monthly salary or daily wages) and other benefits (food, transportation, and housing provisions); for indigenous crafts production – value of sales and costs of production; for crop farming – crops, frequency, volume and value of harvests, and cost of farming inputs; for livestock – annual volume and value of production and costs of production; and for government service and other types of employment – type of work, compensation (salary or wages), and other benefits. Annual income or net revenues generated from each source were estimated, and all income and net revenues from all sources were summed up for each household respondent. Note that revenues from fishing, agriculture, and livestock were computed such that non-cash revenues (e.g., food for home consumption and for giving away to relatives and friends) were also included (i.e., revenues were based on harvest/production value and not on sales value).
Part 3 covered the happiness and economic vulnerability questions as well as all other socioeconomic questions about the household, such as housing assets, consumption, saving and borrowing behavior, membership in organizations, and government and private assistance/subsidies received by the household.
A total sample of 489 respondents was generated through in-person interviews by experienced enumerators of the Research Center of Notre Dame of Marbel University in February 2019. All 19 barangays of Lake Sebu except Ned were included in the sampling frame. Ned is largely agricultural, quite distant and isolated from the rest of the municipality, and not yet part of the developed tourism and fishing industries of Lake Sebu, the economic sectors most closely associated with the rich natural and cultural resources in the municipality, the main focus of this research.1) The number of respondents in each barangay was set in proportion to the share of the barangay in the population of the municipality. Respondents in each barangay were chosen using systematic sampling. Permission and assistance to conduct the survey were secured from the barangay captain’s office. With maps obtained from the barangay office, starting points were identified and enumerators were instructed to approach the 10th house from the starting point. In case of refusal to participate, the next house would be approached. Every succeeding respondent approached had to be the 10th house from the last responding household.
Enumerators were given two-day training prior to the pilot test. The training gave an overview of the objectives of the study, and a detailed explanation of the whole survey instrument (with the meaning and the reasons for each question and statement discussed) and the sampling procedure (systematic sampling method). The training included role-playing exercises.
Measures of Welfare
In this paper, welfare is measured on two dimensions: (1) economic welfare, and (2) social welfare.
The most basic indicator of economic welfare is income, measured as the sum of incomes of household members from all sources. Another indicator of economic welfare used in this study is having food on the table three times a day, that is, not missing meals due to financial difficulties. For this economic welfare indicator, the following question was included in the survey instrument: “In the last three months, has your family missed meal/s or experienced hunger due to lack of money?”
Social welfare is much broader than economic welfare. This paper adopts Richard Easterlin’s (1974, 90) concept and measurement of subjective happiness as an indicator of social welfare: “Happiness . . . corresponds to social welfare,” and “Social welfare is human happiness.” This equality between social welfare and happiness was implied also in the earlier works of Ian Little (1950) and Ezra Mishan (1968).
Also referred to as “self-reported happiness,” subjective happiness is based on statements by the individual about his/her happiness, usually elicited through a survey. This approach in measuring happiness assumes that the individual is the best judge of his/her feelings. A number of studies have shown that self-reported happiness is generally consistent and significantly correlated with objective indicators of happiness such as physical health (Kiecolt-Glaser et al. 2002; Cohen et al. 2003) and evaluations of psychological states such as depression and self-esteem (Bradburn 1969; Robinson and Shaver 1973). John Robinson and Phillip Shaver (1973) have also shown that self-reported happiness does not fluctuate widely over short periods of time and hence can be considered stable and reliable. Daniel Kahneman and Alan Krueger (2006, 3) note the increasing use of subjective well-being data in economic research: “From 2001 to 2005, more than 100 papers were written analyzing data on self-reported life satisfaction or happiness, up from just four in 1991–1995.”
The question posed in our survey instrument follows the 10-point numerical rating scale of Hadley Cantril (1965). The actual question used in our study is “How happy or contented are you with your current living conditions? Please answer using a scale of 0–10 where 0 is very unhappy and discontented and 10 is perfectly happy and contented.” Cantril’s scale was selected over broad categories of happiness (very happy, fairly happy, not very happy) as respondents, particularly Filipinos (as found in the FGDs) are more at ease stating numbers instead of stating directly whether they are happy or not.
Relationship between Resources and Welfare
To investigate how natural and cultural resources in Lake Sebu affect the residents’ welfare, two levels of analysis are done. On the first level, tests of hypothesis on the difference between means/proportions are undertaken. Means/proportions of the welfare indicators, namely, household income and vulnerability to hunger for economic welfare, and self-reported happiness for social welfare, are compared for two sets of subsamples. Set 1 divides the sample into households with multiple sources of income and households with just one source of income. Set 2 categorizes the households by main source of income—namely, fishing, tourism, farming, livestock (all of which are resource-dependent income sources); and all other sources lumped together into non-resource-dependent sources.
The second level of analysis undertaken is regression analysis. Using the econometric software STATA, ordinary least squares, binary probit, and ordered logistic regressions are conducted with indicators of economic welfare (household income and vulnerability to hunger) and social welfare (self-reported happiness) as dependent variables and the following categories of variables as covariates: (1) demographic variables (respondent’s age, gender, education, ethnolinguistic group, number of years in Lake Sebu, household size); (2) natural and cultural-related variables as sources of livelihood; and (3) social capital indicators. John Helliwell and Robert Putnam (2004) have argued that social capital is one of “the most robust correlates of subjective well-being.” Nattavudh Powdthavee (2008) has found that increasing the frequency of social contacts proportionately increases life satisfaction. John Helliwell and Christopher Barrington-Leigh (2010, 15) further suggested that social capital is “more important than economic differences when explaining life satisfaction differences.” Following Robert Putnam’s (1993; 2000) concept of social capital as interpersonal networks (formal and informal associations and engagements), the survey for this study asked about the involvement of household members in organizations such as credit cooperatives, environment-related organizations, women’s organizations, church-related organizations, and labor organizations to come up with social capital variables.
Results
Respondents’ and Households’ Profile
Table 1 shows the profile of survey respondents and their households. The average respondent is 41 years of age (standard deviation of 13 years, median age of 40 years) and has lived in Lake Sebu for 33 years (standard deviation of 16 years, median of 34 years). Nearly half (46%) of the respondents are the head or main breadwinner of the household, and a slightly smaller proportion (38%) are male. Most (78%) of the respondents are working, implying that it is not only the household head who is working in most households. About a third (34%) of respondents reached elementary school level, 42% reached high school, 3% had some vocational training, and 16% reached college level. Only 5% had no formal schooling. About two-thirds of respondents belong to the indigenous T’boli tribe, while 29% are migrant Hiligaynon-Ilonggo. The remaining 4% are a mix of other indigenous groups (such as Ubo-Manubo) and migrants from other places (Cebuano from the Visayas, and Bicolano and Ilocano from Luzon).
Table 1 Socio-demographic Profile of Respondents and Their Households
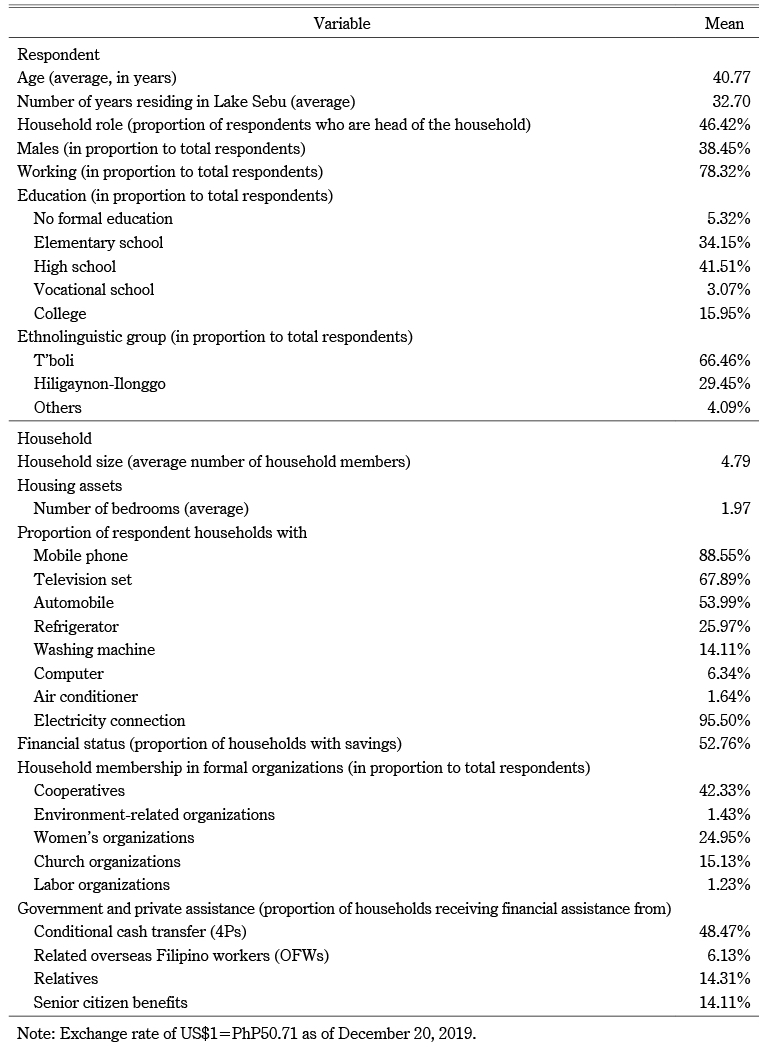
On average, each respondent household has five members (standard deviation of 1.8 and same median of 5) living in a two-bedroom house (standard deviation of 0.9 and same median of 2). The majority of households have an electricity connection, a television set, a mobile phone, and an automobile (including motorcycle and tricycle). The majority (53%) of households have savings. A substantial proportion (42%) are members of cooperatives. Smaller proportions—25% and 15%—are members of women’s and church organizations, respectively. Only 1% of households have member/s in environment-related and labor organizations. With widespread poverty in the municipality, almost half (48%) of respondent households are beneficiaries of the government’s conditional cash transfer program.
Welfare and Resources
Table 2 presents the indicators of economic and social welfare of the households. On average, each household has an annual income of PhP156,701 (US$3,090), with a standard deviation of PhP216,602 implying substantial income variations among households. Comparing individual household incomes with the poverty threshold of PhP10,420 (US$205.48) per month or PhP125,040 (US$2,465.76) per year for a family of five in the province of South Cotabato (PSA 2015), 61%2) of the surveyed households in Lake Sebu are considered to be living in poverty. The percentage of surveyed households living below the food threshold of PhP7,278 (US$143.52) per month or PhP87,336 (US$1,722.24) per year is 46%.
Table 2 Welfare Indicators
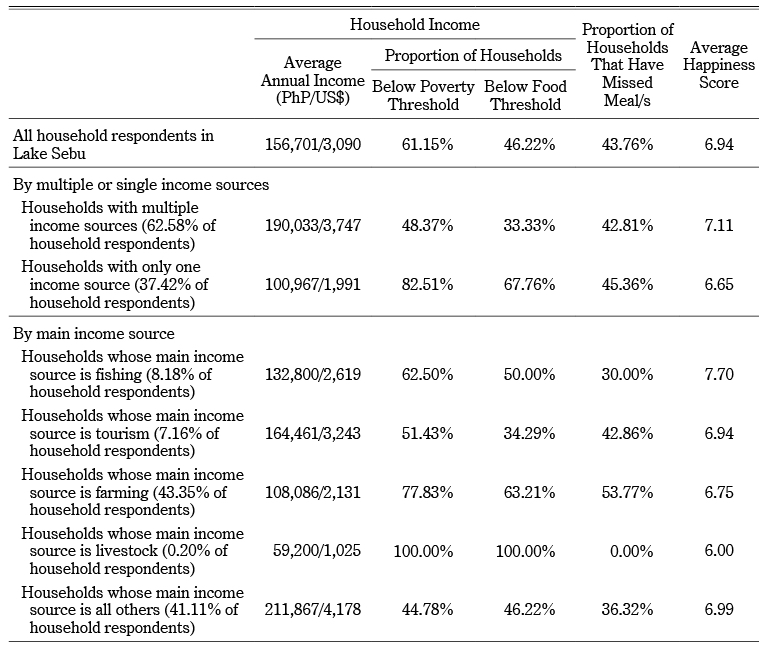
As another indicator of economic welfare, the survey also asked about the household’s vulnerability to hunger. About 44% of respondent households experienced missing meals in the last three months, which corroborates the earlier estimated 46% incidence of food poverty based on reported income.
The average self-reported happiness score of all surveyed households is 6.94 (95% confidence interval of 6.72–7.15), which can be considered fairly or pretty happy. It appears, then, that Lake Sebu households are poor but fairly happy, lending support to Easterlin’s (1974) conclusion that there is no clear correlation between income and happiness.
To probe into the role of natural and cultural resources in household welfare in Lake Sebu, the sample is divided into two subsamples: households with multiple income sources and households with only a single income source. The presence of natural and cultural resources in Lake Sebu offers varied livelihood alternatives with which residents can engage, thus providing varied ways for one or more household members to augment income as well as lower economic vulnerability with another income source to depend on when one source fails.
More than half of the households (63%) have multiple income sources. On average, households with multiple income sources have a higher annual income and hence lower incidence of poverty, lower incidence of hunger, and higher self-reported happiness score (second panel of Table 2).
The third panel of Table 2 divides the sample into five subsamples according to the main income source (classified according to dependence on or use of natural and cultural resources). Among income sources that directly utilize natural and cultural resources, households whose main income source is tourism have the highest average income, followed by households whose main income source is fishing. Low average incomes are reported by households with either livestock or farming as the main income source. Other sources of income (public/government service, transportation, construction, merchandising/retail trading, food, and clothing/apparel), which are not natural and cultural-resource-based, however, yield the highest average. Consequently, poverty and food shortage incidences are higher for households dependent mainly on resource-based incomes, except for tourism-dependent households, which have the lowest incidence of food poverty (lower than other income sources that are not resource based). Interestingly, self-reported hunger and happiness do not closely follow the income trend. Self-reported hunger is lowest for households with livestock and fishing as the main income sources and highest for farming and tourism-dependent households. Non-resource-based households are somewhere in the middle of the spectrum. For overall welfare, fishing-dependent households have a substantially higher happiness score (7.7) than all other categories, with almost a one-point difference from other non-resource-dependent income sources (6.99), tourism (6.94), and farming (6.75). Livestock-dependent households lag behind the rest with an average happiness score of only 6.00.
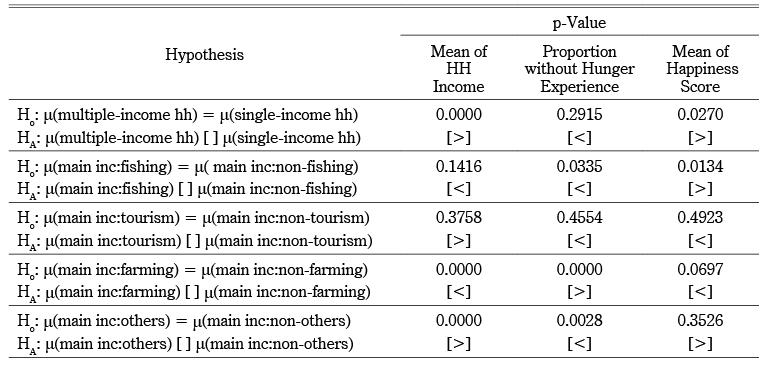
Tests of hypothesis on the difference between means (for the welfare indicators household income and happiness score) and between proportions (for the welfare indicator vulnerability to hunger) were conducted to determine whether the observed differences in the sample as discussed above were statistically significant and hence relevant for the whole population. Test results presented in Table 3 reveal the following: (1) the higher household income and happiness score of multiple-income households relative to single-income households are statistically significant, but there is no statistically significant difference in the hunger experience of the two subsamples; (2) the happiness score of fishing households is statistically higher than that of non-fishing households, and their hunger experience is statistically lower; (3) tourism-dependent households are not statistically different from the rest in terms of all three welfare measures; (4) farming households have statistically lower income and statistically higher hunger experience, but they are statistically happier than the rest; and (5) households whose main income source is not resource dependent have statistically higher income and statistically lower hunger experience, but their happiness score is not statistically higher than the rest.
Table 3 Test of Hypothesis on Difference between Populations
Regression Results
To give a fuller picture of factors that contribute to household welfare in this resource-rich municipality, three sets of regression are undertaken: (1) ordinary least squares regression of household income, (2) binary probit regression of the households’ vulnerability to hunger, and (3) ordered logistic regression of self-reported happiness.
The household income regression (column 2 of Table 4) reveals that indeed multiple income sources significantly raise household income, as also found in the earlier test of hypothesis. The regression results also show that the income of households whose main income source is resource based (fishing, tourism, or farming) is significantly lower than the income of non-resource-based income households. The annual income of households whose main income source is non-resource based is about PhP85,000 higher than that of mainly fishing-dependent households, PhP61,000 higher than that of mainly farming households, and PhP62,000 higher than that of mainly tourism-dependent households. Other factors that significantly affect household income are the age of the respondent, ethnolinguistic group, and membership in cooperatives. Households belonging to minor ethnolinguistic groups have higher income than the majority T’boli and the second major group, Hiligaynon-Ilonggo. Older respondents belong to higher-income households. And income of households with membership in cooperatives is about PhP59,000 higher.
Table 4 Regression Results: Welfare Factors
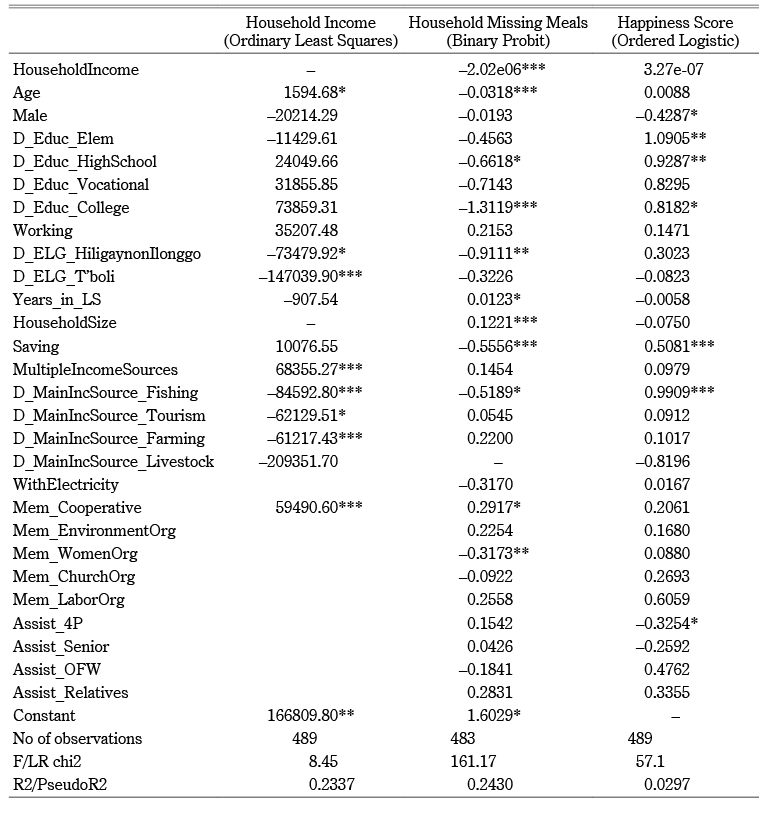
The binary probit regression results (column 3 of Table 4) indicate that households with higher income, with an older and more educated head, with fewer members, who are relatively newer in Lake Sebu, with savings and membership in cooperatives are less likely to experience hunger. Households with membership in women’s organizations are more likely to miss meals.
The ordered logistic regression (column 4 of Table 4) shows that household income does not significantly affect happiness. Female respondents are found to be happier than male respondents. The coefficients of the dummy variables for levels of education are significantly positive, implying that respondents with some education are happier than those without any education. Interestingly, however, the positive value of the coefficient of the dummy for education level becomes smaller the higher the education level, implying that respondents with more years of education reported slightly lower happiness scores than those with less. Respondents belonging to households with savings and whose main income source is fishing also have a higher reported happiness score. Ironically, households receiving conditional cash transfers (4Ps) from the government appear to be less happy. Literature on the effects of conditional cash transfer in the Philippines has been focused on the education outcomes (change in enrollment rate) and changes in child labor incidence rate as the assistance has been aimed at, and hence availment has been made contingent upon, the children in the household attending school. Past studies have consistently found some improvement in the enrollment rate, particularly among younger children. Ronaldo Frufonga (2015) and Aniceto Orbeta Jr. and Vicente Paqueo (2016) concluded that conditional cash transfer resulted in a decline in the incidence of child labor and an increase in household expenditures on education. Orbeta and Paqueo (2016) specifically found a decline in time spent on paid work of children in the household, while Nazmul Chaudhury and Okamura Yuko (2012) noted that sending older children to school was associated with higher direct (school fees and supplies, transportation costs) and indirect (opportunity) costs—the forgone income of children being sent to school instead of working. The additional burden and responsibilities of sending children to school, while the returns to education may be realized only in the long run, may account for the negative effect of 4Ps on happiness. Finally, none of the social capital indicators, in terms of membership in formal organizations, significantly affects the happiness score.
Conclusions
The findings of the study can be summarized into the following three points.
First, the study suggests mixed implications of abundant natural and cultural resources on the income, livelihood, and happiness of people in Lake Sebu. Nonetheless, insofar as the availability of natural and cultural resources provides more opportunities for income-generating activities, and hence makes possible multiple-income households, abundant resources in Lake Sebu may be considered a blessing and a significant contributor to welfare. Based on population mean/proportion difference test results, multiple-income households have higher income (economic welfare) and self-reported happiness (overall welfare). The OLS regression result indicates that annual income of multiple-income households is higher than that of single-income households by about PhP70,000. Mixed results, however, are obtained when the analysis is done by type of main income source. Households whose main income source is non-resource based have significantly higher economic welfare (higher income and accordingly lower vulnerability to hunger). Among mainly resource-based income earning households, fishing households register higher welfare indicators (in terms of lower vulnerability to hunger and higher happiness score) while farming households register lower welfare in terms of all three indicators. Findings from the KIIs and FGDs provide some explanations for these results. Several fish cage operators appear to also have non-resource-based income sources (such as permanent or contractual work in the local government). The need for regular financial capital for fish cage operations could have made it necessary for fish cage operators to find other sources of income, or it could be that other sources of regular income have made possible engagement in aquaculture operations. Either situation suggests that income benefits from abundant fishing resources (lakes that are highly favorable to aquaculture) can be realized only if there are other sources of income to provide the required financial capital. The low welfare conditions of farming in Lake Sebu, on the other hand, are reflective of general farming conditions in the Philippines. The resource curse appears to apply to farming in Lake Sebu, just like in other places in the Philippines (see, for instance, World Bank 2017). Further, the study reveals that tourism resources in Lake Sebu have not yet yielded significant benefits for residents.
Second, regression analysis of survey data on income and self-reported happiness in Lake Sebu reveals no significant positive relationship between income and happiness, supporting Moses Abramovitz’s (1959) skepticism about A. C. Pigou’s dictum that “changes in economic welfare indicate changes in social welfare in the same direction, if not in the same degree” (Abramovitz 1959). Easterlin (1974) argues that an increase in income leads to an escalation of human aspirations and thus negates the expected positive impact on welfare. This is, however, not quite the case for the largely rural, indigenous population of Lake Sebu, who are naturally contented with subsistence income or just having enough to survive, and who have the custom or habit of focusing more on the spirit (the nonmonetary, nonmaterial aspects of life) than the flesh. Along the lines of Easterlin’s argument, it may be that the norm of just maintaining subsistence income prevents the escalation of economic aspirations.
Finally, the case of Lake Sebu does not support the hypothesis that social capital matters for happiness. This may be because the social capital variables used in the study are limited to formal associational capital, that is, membership in formal organizations (cooperatives, churches, social and livelihood organizations). Andrés Rodríguez-Pose and Viola von Berlepsch (2014) note that the main drivers of the effects of social capital on happiness appear to be informal social interaction and general social as well as institutional trust, dimensions that unfortunately are not included in this study.
Accepted: November 30, 2020
Acknowledgments
This paper is one of several research papers resulting from a research project titled “The Total Economic Value of the Lake Sebu Natural and Cultural Resources.” The research was undertaken with financial support from the Commission on Higher Education (CHED) of the Philippines and research support from the University Research Council (URC) of the Ateneo de Manila University. The authors gratefully acknowledge the excellent research assistance of Ms. Marilyn Palanca, Ms. Kristine Alloro, Mr. Jose Adlai Tancangco, and Mr. Gerome Vedeja, and the enthusiastic participation of survey enumerators and respondents.
References
Abramovitz, Moses. 1959. The Welfare Interpretations of Secular Trends in National Income and Product. In The Allocation of Economic Resources: Essays in Honor of Bernard Francis Haley, edited by M. Abramovitz et al., pp. 1–22. Stanford: Stanford University Press.↩ ↩
Asian Development Bank (ADB). 2005. An Evaluation of Small-scale Freshwater Rural Aquaculture Development for Poverty Reduction. Manila: Operations Evaluation Department, ADB.↩
Balco, B. 2012. A Strategic Framework for Mapping Out Employment Opportunities in the Cultural Heritage Sector. Paper presented at the Institute for Labor Studies Forum on Cultural Heritage: Heritage Employment. It’s More Fun in the Philippines, Ortigas Foundation Library, Pasig City, July 11.↩
Bradburn, Norman M. 1969. The Structure of Psychological Well-being. Chicago: Aldine.↩
Bradecina, Raul G. 2014. Economic Valuation of the Caramoan, Camarines Sur Beachscape: An Environmental Services Payment Scheme for Sustainable Ecotourism. EEPSEA Research Report 2014-RR3. Los Banos: EEPSEA Philippines Office.↩
Broad, Robin. 1995. The Political Economy of Natural Resources: Case Studies of the Indonesian and Philippine Forest Sectors. Journal of Developing Areas 29(3): 317–340.↩ ↩ ↩
Cantril, Hadley. 1965. The Pattern of Human Concerns. New Brunswick: Rutgers University Press.↩
Chaudhury, Nazmul; and Okamura Yuko. 2012. Conditional Cash Transfers and School Enrollment: Impact of the Conditional Cash Transfer Program in the Philippines. The Philippine Social Protection Note 6: 1–20.↩
Cohen, Sheldon; Doyle, William J.; Turner, Ronald B.; Alper, Cuneyt M.; and Skoner, David P. 2003. Emotional Style and Susceptibility to the Common Cold. Psychosomatic Medicine 65(4): 652–657. doi: 10.1097/01.psy.0000077508.57784.da.↩
Coxhead, Ian; and Jayasuriya, Sisira. 2001. Economic Growth, Development Policy and the Environment in the Philippines. Agricultural & Applied Economics Staff Paper No. 430, University of Wisconsin-Madison. doi: 10.22004/ag.econ.12643.↩ ↩
Cruz, Geoffrey Rhoel. 2017. The Cultural Heritage-Oriented Approach to Economic Development in the Philippines: A Comparative Study of Vigan, Ilocos Sur and Escolta, Manila. Paper presented at the 10th DLSU Arts Congress, De La Salle University, Manila, February 16.↩
Cruz, Wilfredo; and Francisco, Herminia. 1993. Poverty, Population Pressure and Deforestation in the Philippines. Paper presented at a workshop on Economy-wide Policies and the Environment, World Bank, Washington, DC, December 14–15.↩
Datu, Jesus Alfonso D.; and Lizada, Gabriel Sebastian N. 2018. Interdependent Happiness Is Associated with Higher Levels of Behavioral and Emotional Engagement among Filipino University Students. Philippine Journal of Psychology 51(1): 63–80. doi: 10.31710/pjp/0051.01.04.↩
Diego, Arnel A.; Cerna, Lyle C. de la; and Agdeppa, Joan Y. 2018. Happiness among Selected Filipino Elderly: A Consensual Qualitative Research. Advanced Science Letters 24(4): 2611–2615. doi: 10.1166/asl.2018.11017.↩
Easterlin, Richard A. 1974. Does Economic Growth Improve the Human Lot? Some Empirical Evidence. In Nations and Households in Economic Growth: Essays in Honor of Moses Abramovitz, edited by P. A. David and M. W. Reder, pp. 89–125. New York: Academic Press. doi: 10.1016/B978-0-12-205050-3.50008-7.↩ ↩ ↩
Frufonga, Ronaldo F. 2015. The Pantawid Pamilyang Pilipino Program (4Ps) in Iloilo, Philippines: An Evaluation. Asia Pacific Journal of Multidisciplinary Research 3(5), Part 2: 59–65.↩
Fujisaka, Sam; Sajise, Percy E.; and del Castillo, Romulo A., eds. 1986. Man, Agriculture and the Tropical Forest: Change and Development in the Philippine Uplands. Bangkok: Winrock International.↩
Helliwell, John F.; and Barrington-Leigh, Christopher P. 2010. How Much Is Social Capital Worth? NBER Working Paper No. 16025, National Bureau of Economic Research. doi: 10.3386/w16025.↩
Helliwell, John F.; and Putnam, Robert D. 2004. The Social Context of Well-being. Philosophical Transactions of the Royal Society B Biological Sciences 359(1449): 1435–1446. doi: 10.1098/rstb.2004.1522.↩
Henderson, Joan C. 2012. Conserving Heritage in South East Asia: Cases from Malaysia, Singapore and the Philippines. Tourism Recreation Research 37(1): 47–55. doi: 10.1080/02508281.2012.11081687.↩
Kahneman, Daniel; and Krueger, Alan B. 2006. Developments in the Measurement of Subjective Well-being. Journal of Economic Perspectives 20(1): 3–24. doi: 10.1257/089533006776526030.↩
Karak, Madhuri. 2019. Is the “Resource Curse” a Myth? JSTOR Daily, September 5.↩
Kiecolt-Glaser, Janice K.; McGuire, Lynanne; Robles, Theodore F.; and Glaser, Ronald. 2002. Psychoneuroimmunology: Psychological Influences on Immune Function and Health. Journal of Consulting and Clinical Psychology 70(3): 537–547. doi: 10.1037//0022-006x.70.3.537.↩
Kummer, David M. 1992. Deforestation in the Postwar Philippines. Manila: Ateneo de Manila University Press.↩
Labadi, Sophia, ed. 2020. The Cultural Turn in International Aid: Impacts and Challenges for Heritage and the Creative Industries. New York: Routledge.↩
Lake Sebu Municipal Planning and Development Office (LSMPDO). 2016. Lake Sebu Socio-economic and Ecological Profile. Lake Sebu Municipal Government, South Cotabato.↩ ↩
―. 2015. Lake Sebu Comprehensive Land Use Plan 2014–2023. Lake Sebu Municipal Government, South Cotabato.↩
Little, Ian Malcolm David. 1950. A Critique of Welfare Economics. London and New York: Oxford University Press.↩
Lumontod III, Robinson Z. 2019. The Role of Goal Concordance on Happiness and College Students’ Academic Performance. International Journal of Research Studies in Psychology 8(1): 63–78. doi: 10.5861/ijrsp.2019.4000.↩
Management Association of the Philippines – Agribusiness and Countryside Development Foundation (MAP-ABCD). 2016. Seaweed Farming as Exponent of Inclusive Growth: Seaweed Industry Association of the Philippines. www.map-abcdf.com.ph, accessed July 18, 2017.↩
Medina, Eva Marie S. 2009. The Vigan City Heritage Conservation Program: A Tool for Development. Paper presented at the Penang International Conference on Sustainable Cultural Development, October 8–9.↩
Mishan, Ezra J. 1968. Welfare Economics. International Encyclopedia of the Social Sciences, Vol. 16, pp. 504–512. New York: Macmillan.↩
Orbeta Jr., Aniceto C.; and Paqueo, Vicente B. 2016. Pantawid Pamilya Pilipino Program: Boon or Bane? Philippine Institute for Development Studies (PIDS) Discussion Papers DP 2016-56.↩ ↩
Organisation for Economic Co-operation and Development (OECD). 2011. The Economic Significance of Natural Resources: Key Points for Reformers in Eastern Europe, Caucasus and Central Asia. Paris: OECD.↩
Orogun, Paul S. 2010. Resource Control, Revenue Allocation and Petroleum Politics in Nigeria: The Niger Delta Question. GeoJournal 75(5): 459–507. doi: 10.1007/s10708-009-9320-7.↩
Palanca-Tan, Rosalina. 2020. Willingness to Pay of Urban Households for the Conservation of Natural Resources and Cultural Heritage in a Neighboring Rural Area: A CVM Study. Philippine Journal of Science 149(2): 393–403.↩
―. 2016. Profile of an Aquaculture-Dependent Community in a Tropical Country. Journal of Social, Political, and Economic Studies 41(3): 3–27.↩ ↩
Palanca-Tan, Rosalina; Chico-Almaden, Catherine Roween; Navarro, Kresna; Melendez-Obedencio, Marichu; and Rubio-Sereñas, Caroline. 2018. Total Economic Value of the Cagayan de Oro River Basin. In Innovation Addressing Climate Change Challenges: Market-Based Perspectives, edited by Mona Hymel, Larry Kreiser, Janet E. Milne, and Hope Ashiabor, pp. 169–183. Cheltenham: Edward Elgar. doi: 10.4337/9781788973366.00025.↩ ↩
Palanca-Tan, R.; Obedencio, M.; and Serenas, C. 2017. Household Benefits from the Cagayan de Oro River Basin Ecosystem. In Toward the Future of Asia: Best Papers of the 3rd Asia Future Conference, edited by Imanishi Junko, pp. 33–40. Tokyo: Japan Book.↩
Pedrosa III, Alfredo A. 2017. Current Status of Philippine Seaweed Industry. Paper presented at the Regional Scientific Meeting: Attaining Sustainable Development Goals: Philippine Fisheries and Other Aquatic Resources 20/20, SMX Convention Center, Davao City, March 13–14. https://www.nast.ph/index.php/downloads/category/108-day-1-march-13-2017?download=346:4-plenary-2-mr-pedrosa-iii, accessed July 18, 2018.↩
Peterson, William. 2016. Places for Happiness: Community, Self, and Performance in the Philippines. Honolulu: University of Hawai‘i Press.↩
Philippine Statistics Authority (PSA). 2015. Census of Population. https://psa.gov.ph/population-and-housing/previous-release/2015, accessed December 7, 2019.↩ ↩
Powdthavee, Nattavudh. 2008. Putting a Price Tag on Friends, Relatives, and Neighbours: Using Surveys of Life Satisfaction to Value Social Relationships. Journal of Behavioral and Experimental Economics (formerly The Journal of Socio-Economics) 37(4): 1459–1480. doi: 10.1016/j.socec.2007.04.004.↩
Putnam, Robert D. 2000. Bowling Alone: The Collapse and Revival of American Community. New York: Simon & Schuster.↩
―. 1993. Making Democracy Work: Civic Traditions in Modern Italy. Princeton: Princeton University Press.↩
Reyes, Joseph Anthony L. 2016. Exploring Leisure Time Activities and Sociodemographic Indicators of Subjective Happiness and Self-Perceived Health among Filipinos. Austrian Journal of South-East Asian Studies 9(2): 269–288. doi: 10.14764/10.ASEAS-2016.2-6.↩
Robinson, John P.; and Shaver, Phillip R. 1973. Measures of Social Psychological Attitudes. Revised Edition. Ann Arbor: Institute for Social Research, University of Michigan.↩ ↩
Rodríguez-Pose, Andrés; and von Berlepsch, Viola. 2014. Social Capital and Individual Happiness in Europe. Journal of Happiness Studies 15: 357–386. doi: 10.1007/s10902-013-9426-y.↩
Rosario, Westley R. 2008. The Philippines. In Proceedings of the FAO/NACA Regional Workshop on the Future of Mariculture: A Regional Approach for Responsible Development in the Asia-Pacific Region, Guangzhou, China, 7–11 March 2006, edited by A. Lovatelli, M. J. Phillips, J. R. Arthur, and K. Yamamoto, pp. 225–240. Rome: Food and Agriculture Organization of the United Nations.↩
Subade, Rodelio. 2007. Mechanisms to Capture Economic Values of Marine Biodiversity: The Case of Tubbataha Reefs UNESCO World Heritage Site, Philippines. Marine Policy 31(2): 135–142. doi: 10.1016/j.marpol.2006.05.012↩
Tejero, Wilma M. 2014. An Analysis of the Recreational Use Value of Apo Island, Philippines. EEPSEA Research Report 2014-SRG3. Los Banos: EEPSEA Philippines Office.↩
Tolentino, Marvin N.; and Dullas, Angelo R. 2015. Subjective Well-being of Filipino Farm Children. International Journal of Research Studies in Psychology 4(4): 47–60. doi: 10.5861/ijrsp.2015.1265.↩
World Bank. 2017. Philippines Mindanao Jobs Report: A Strategy for Mindanao Regional Development. Washington D.C.: World Bank Publications, World Bank Group. doi: 10.1596/28291.↩ ↩ ↩
Yap, Wilfredo G. 1999. Rural Aquaculture in the Philippines. Bangkok: Regional Office for Asia and the Pacific, Food and Agriculture Organization of the United Nations.↩
1) Although Ned occupies 47% of the municipality of Lake Sebu, its population density is just 0.62 person per hectare (26,088 people in 41,802 ha). More than 55% of its total area is protected forest, while 40% is agricultural (planted with mainly corn, rice, and peanuts).
2) This figure is very close to the 2015 official poverty index in the municipality of Lake Sebu of 64% (PSA 2015).
![]()
